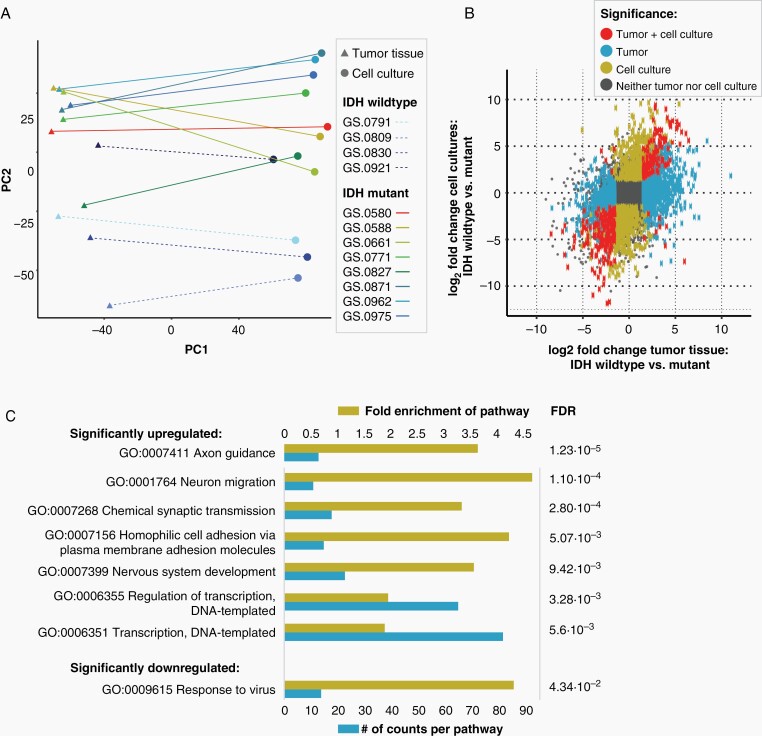
Figure 3.
Correlation of transcriptomics of IDHmt cell cultures and parental tumor tissue. One sample was analysed from each tumor and derived culture (N = 8 IDHmt, N = 4 IDHwt) (A) Clustering of glioma cell cultures and tumor tissues based on RNA expression through principal component analysis. Components 1 and 2 are shown. (B) Scatterplot showing the correlation between the log2 fold change of IDHwt versus mutant in tumor tissues (X-axis) and IDHwt versus mutant in cell cultures (Y-axis). The grey square represents the cut-off for the identification of differentially expressed genes, set at a log2 fold change larger than –1.5 or smaller than 1.5. (C) Gene ontology pathway analysis of significantly upregulated or downregulated pathways in IDHmt versus IDHwt cell cultures (adjusted P-value < .05). The size of the blue bars represents the number of DEGs in that pathway (bottom X-axis), and yellow bars represents the fold enrichment (FE) of the pathway (top X-axis). The false discovery rate values are shown on the right side of the graph.

