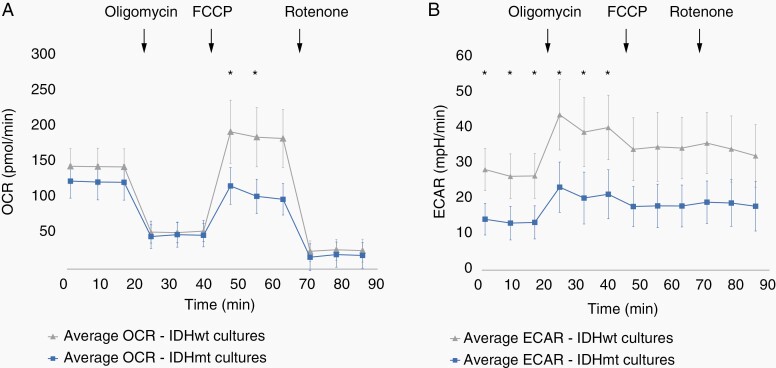
Figure 4.
Live cell metabolic analysis of IDHmt glioma cultures. (A) Mean OCR of IDHmt cultures (blue, N = 6) and IDHwt cultures (grey, N = 7). (B) Mean ECAR of IDHmt cultures (blue, N = 6) and IDHwt cultures (grey, N = 7). Error bars represent the pooled standard deviations. Asterisks indicate significantly different mean OCR or ECAR values at the indicated timepoint (Independent Student’s T-test, P < .5). Error bars represent the SD. Ten technical replicates were tested for each culture.

