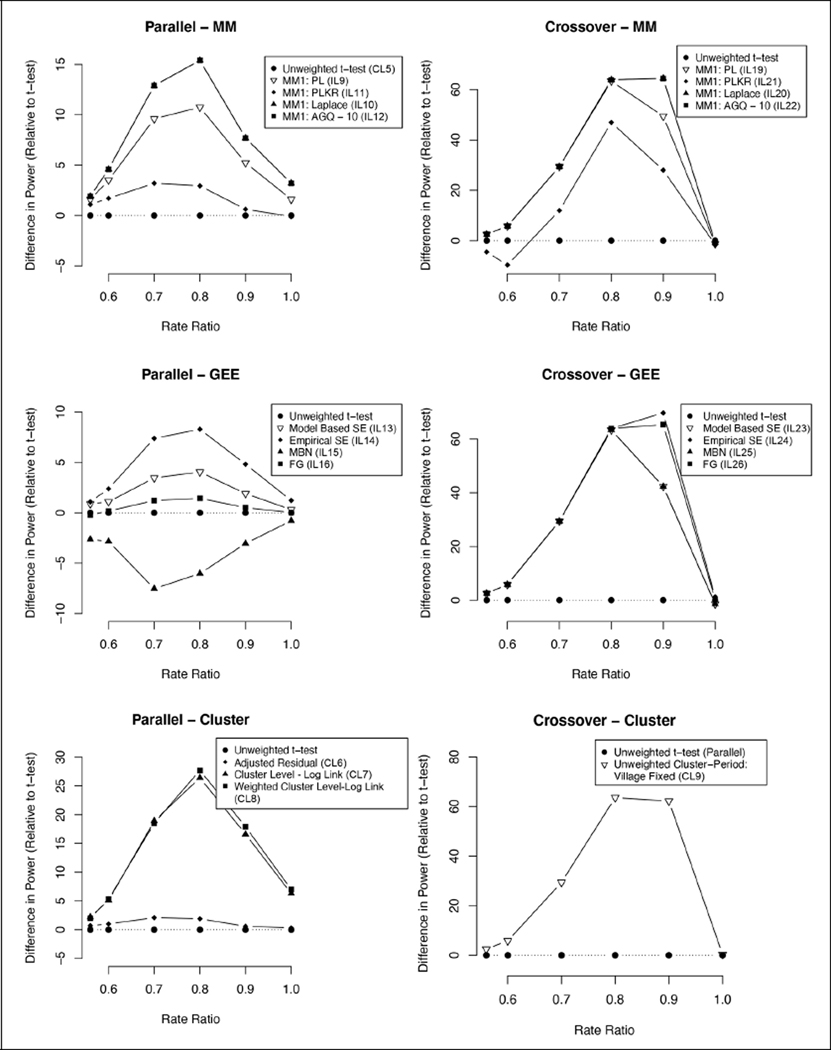
Figure 2. Difference in power relative to unweighted t-test (parallel versus crossover—two rainy seasons).
Graphs indicating the difference in one-sided power for the three analysis frameworks (MM, GEE, and cluster-level summaries) and two multi-season study designs (parallel versus crossover) relative to the parallel unweighted t-test for a range of rate ratios. A rate ratio of 1 reflects the null model. The first rate ratio of approximately 0.56 reflects the expected rate ratio for RIMDAMAL II. Models with two random effects were excluded because they were generally similar and difficult to discriminate in the figure.

