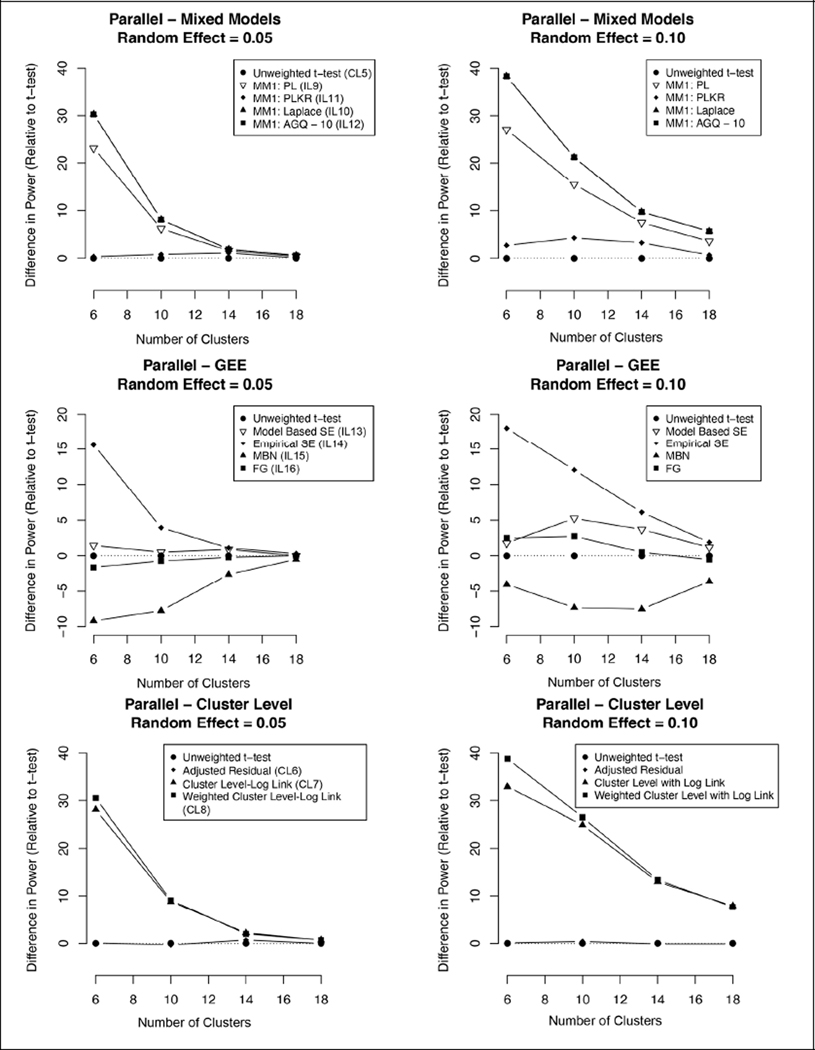
Figure 3. Difference in power relative to unweighted t-test (2-year parallel design—cluster sizes and random effect variance).
Graphs indicating the difference in one-sided power for the three analysis frameworks relative to the unweighted t-test for a range of cluster sizes and two different random effect variances. Only 2-year parallel designs are shown; crossover and single-year study designs with differing cluster and random effect sizes were not simulated.

