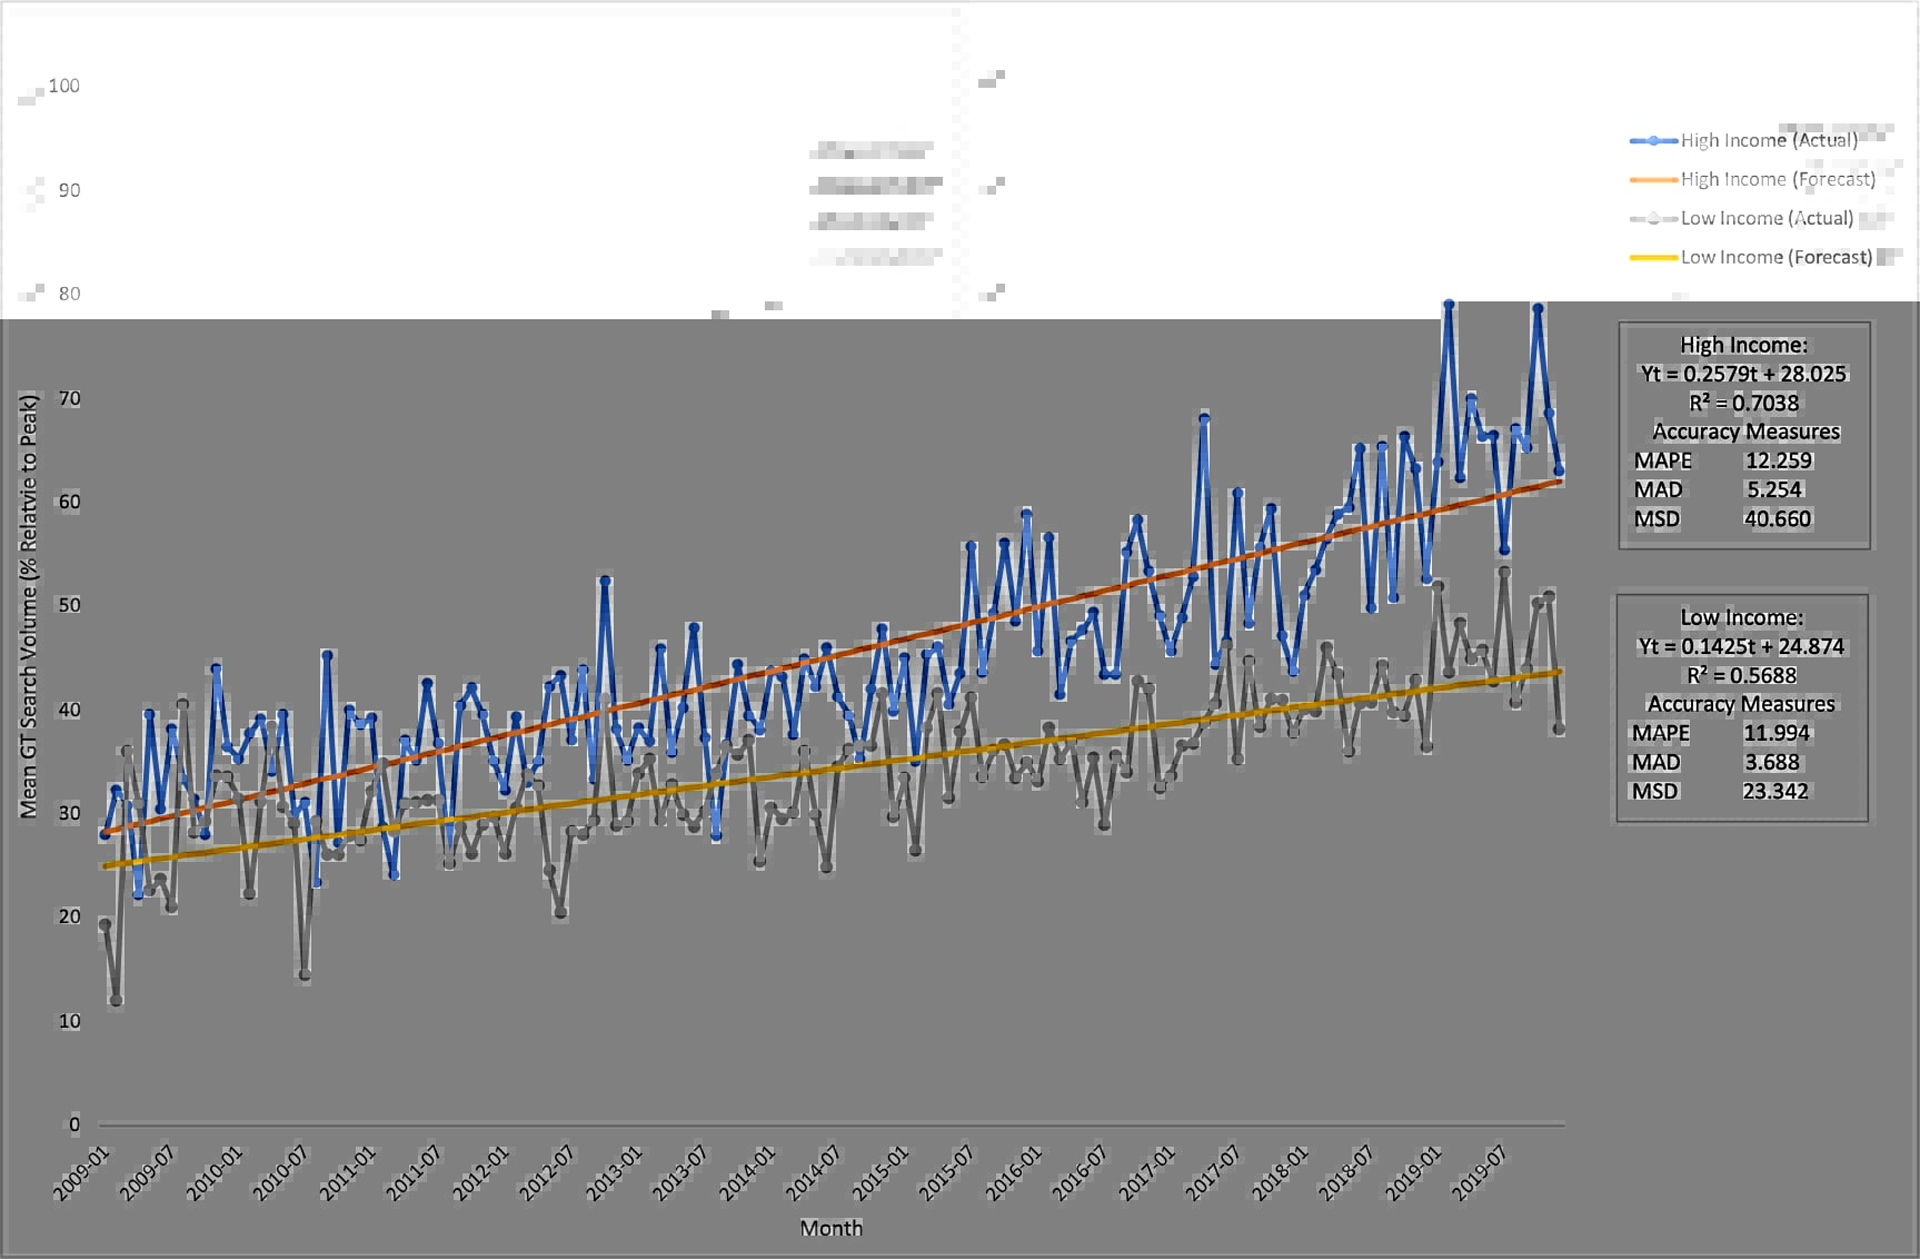
Figure 2: Linear trend model for PRP and Hip/Knee Arthritis in Highest/Lowest Income States.

Linear trend model for platelet-rich plasma and hip/knee osteoarthritis in the five highest income and five lowest income states, 2009–2019. MAPE, mean absolute percentage error; MAD, mean absolute deviation; MSD, mean squared deviation; GT, Google Trends.
