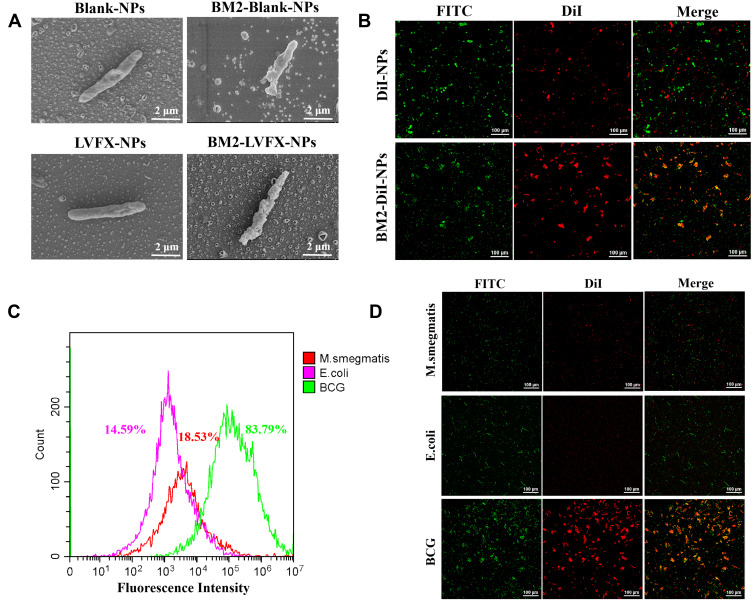
Figure 4.
Specific targeting performance and binding evaluation in vitro. (A) SEM pictures of BCG after incubation with nanoparticles modified with or without BM2 aptamer. (B) CLSM images of BCG treated with DiI-NPs/BM2-DiI-NPs, respectively. The scale bar is 100 μm. (C) The binding efficiency of M.smegmatis, E. coli and BCG was quantitatively analyzed by flow cytometry after incubation with BM2-DiI-NPs for 5 h. (D) CLSM images of M.smegmatis, E. coli and BCG after incubation with BM2-DiI-NPs for 5 h. The scale bar is 100 μm.

