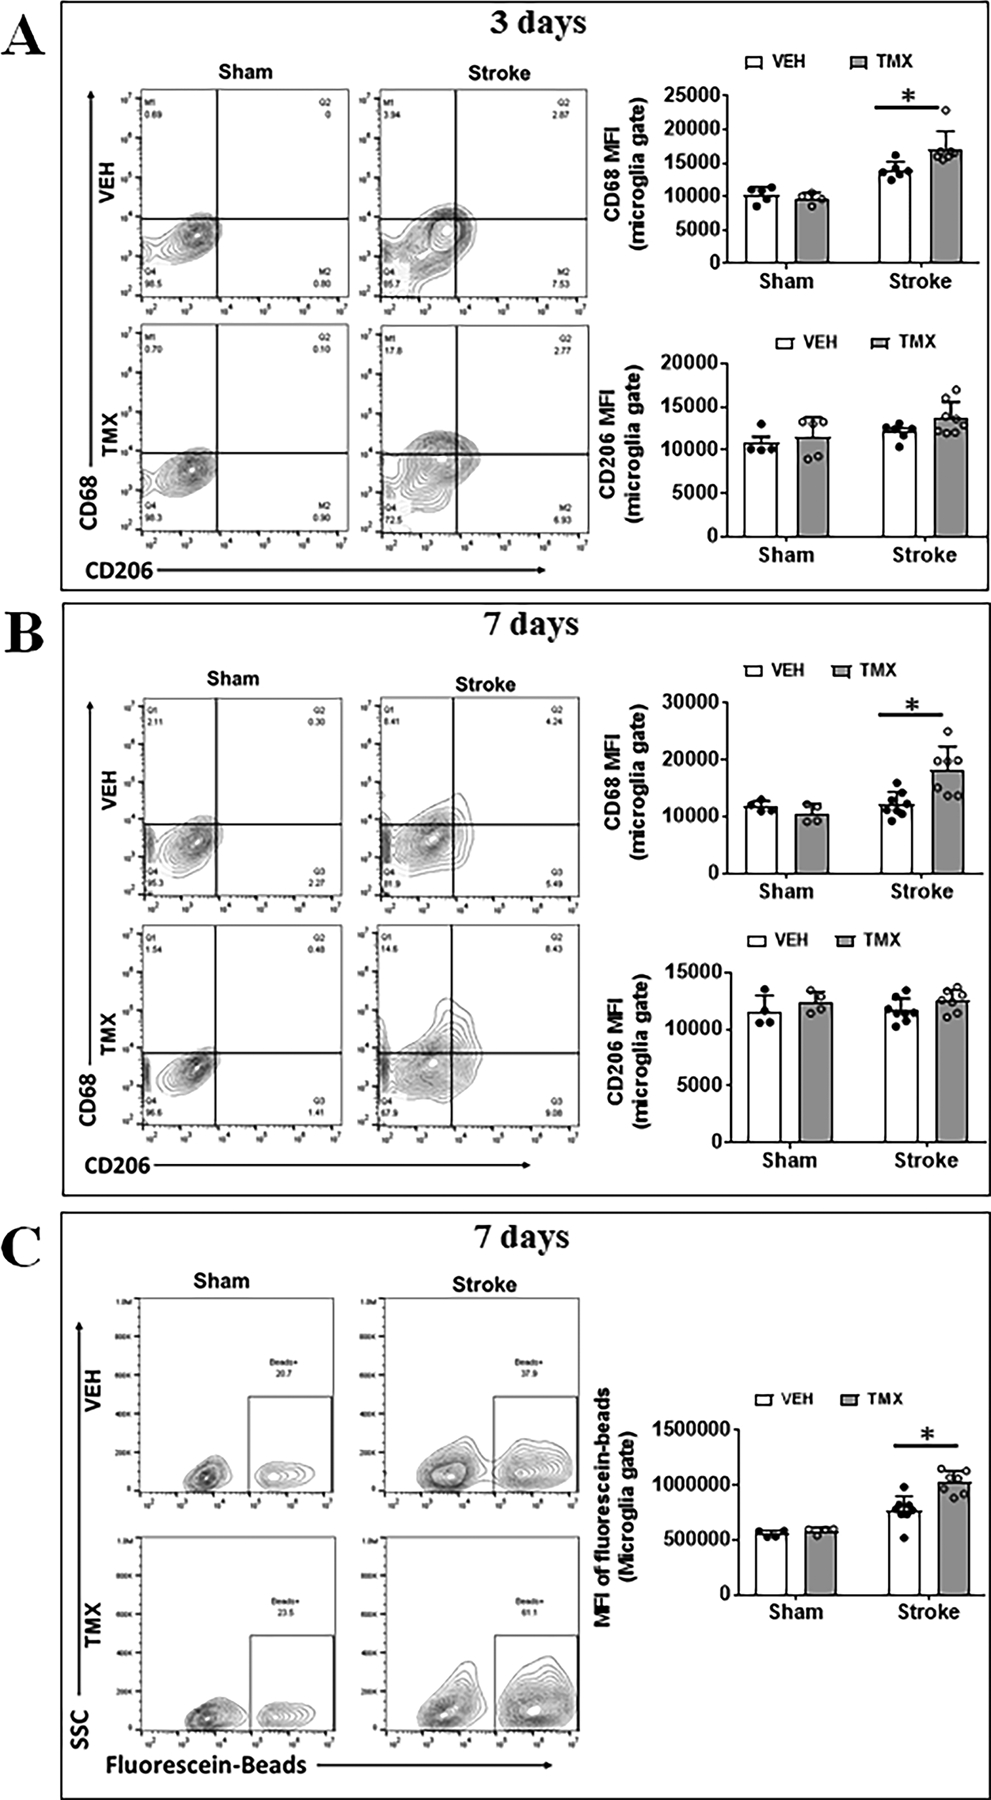
Figure 3.

Microglial activation after stroke in TMX and VEH treated mice. Representative FC plots of CD68/CD206 expressed on microglia at 3d (A) and 7d (B) after MCAO. Quantitative expression of CD68 and CD206 was measured as mean fluorescence intensity (MFI). (C) Representative plots illustrate the phagocytic activity of microglia at 7d after MCAO, which was quantified by MFI of bio-particles in microglia. N=6–8 stroke/4–5 sham animals per group; *P < 0.05.
