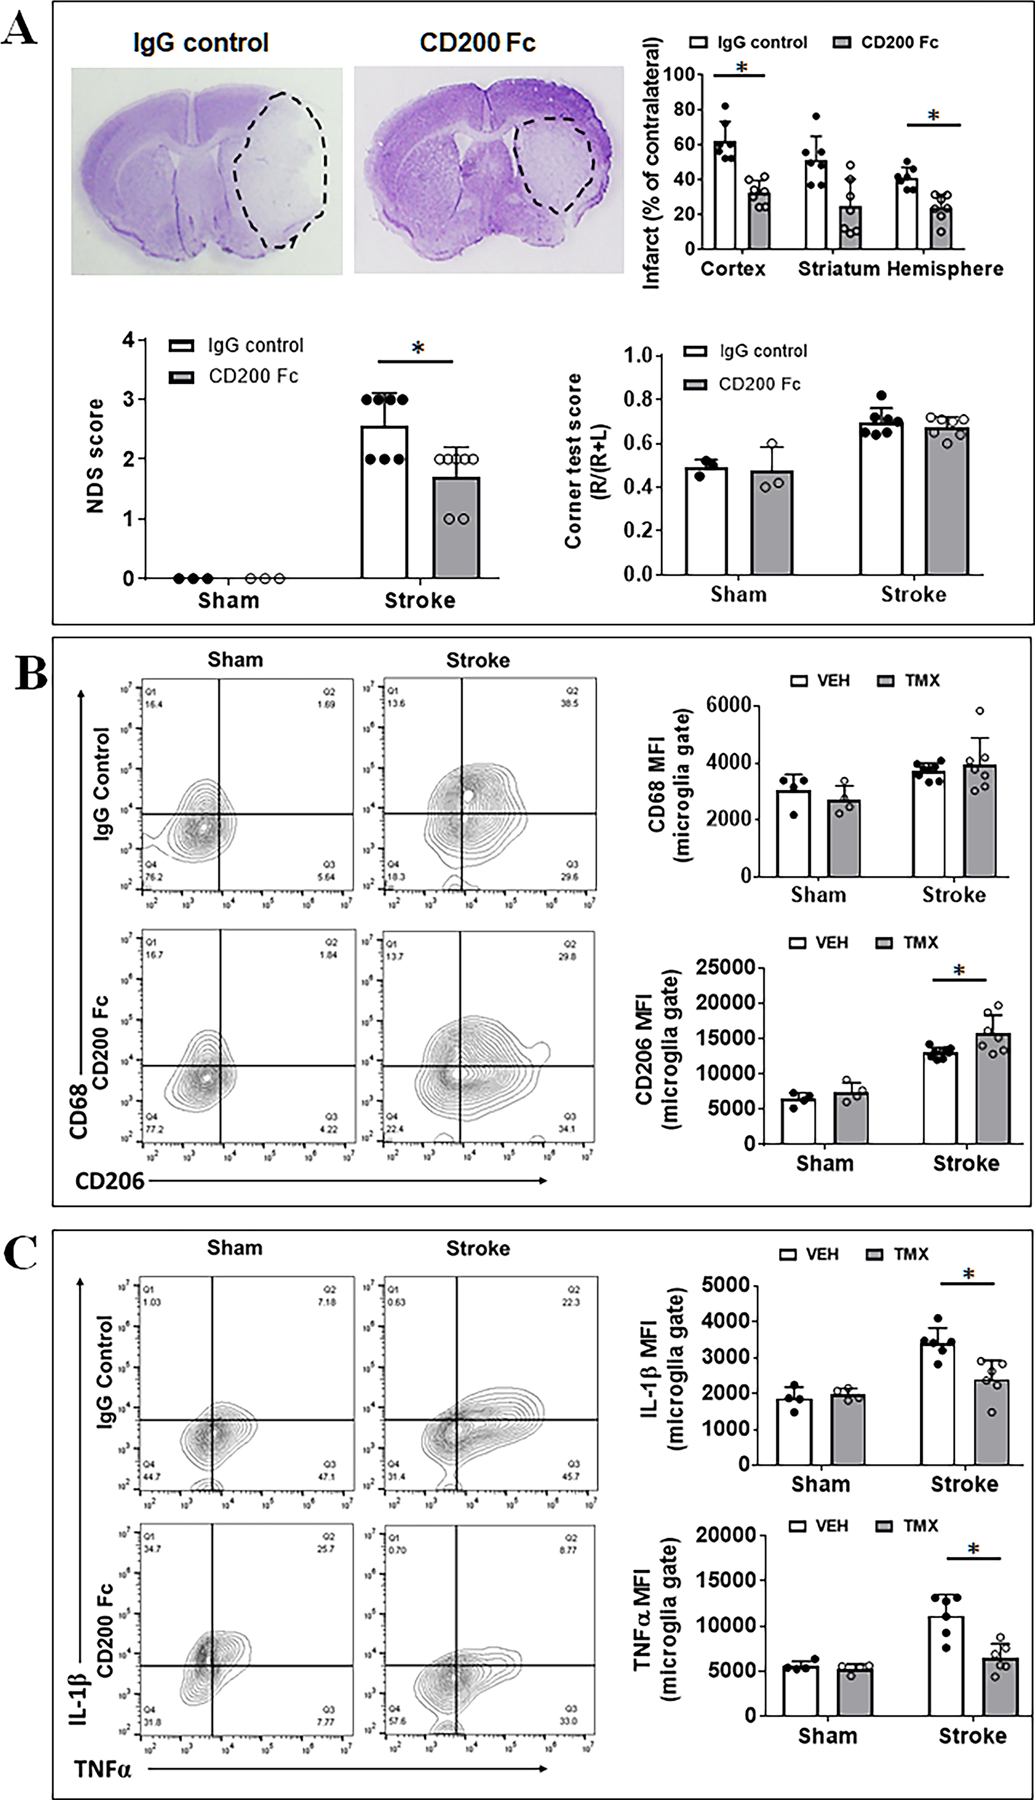
Figure 5.

Stroke outcomes and flow cytometry in CD200 Fc treated mice. (A) Representative images of brain slices stained with cresyl violet (CV) and quantification of brain infarct volumes, NDS, and corner test scores in CD200Fc vs. IgG treated mice. N=3 for sham and 6–7 for stroke per group; *P < 0.05. (B) Microglial expression of cell membrane markers CD68/CD206 measured as mean fluorescence intensity (MFI). (C) Microglial expression of intracellular markers IL-1β/TNFα. For (B) and (C), n=4/sham group and n=6/stroke group; *P < 0.05.
