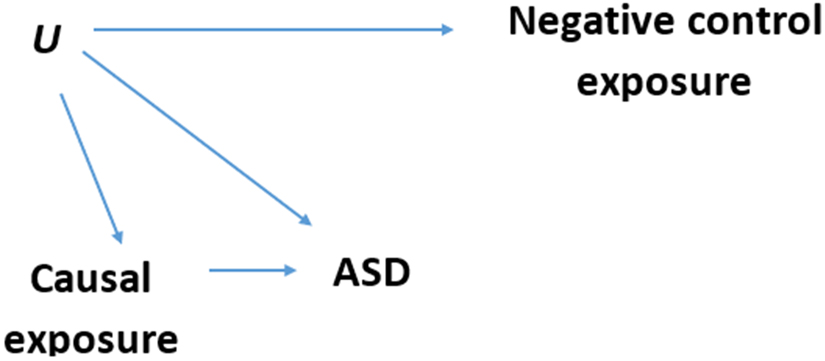
Figure 1. Negative control exposure Directed Acyclic Graph (DAG).
Each arrow in the DAG represents an assumption of a causal relationship, and the lack of an arrow represents an assumption of no causal relationship. Causal exposure = possibly causal periods of exposure: 9 months before pregnancy, entire pregnancy period, and 9 months after birth; Negative control exposure = non-causal period of exposure (post-outcome): at age 28-36 months (or for the secondary negative control: 9 months after diagnosis); ASD = autism spectrum disorder (the outcome). U = unobserved confounder(s); An association between the negative control exposure and the outcome persists with adjustment for possibly causal exposures if and only if the arrow U → ASD exists. Such an association is not causal. The path that creates it is (in DAGs terminology) a backdoor path (from the outcome through the possibly causal exposure and U to the negative control exposure) that serves to assess residual confounding in the primary analyses.

