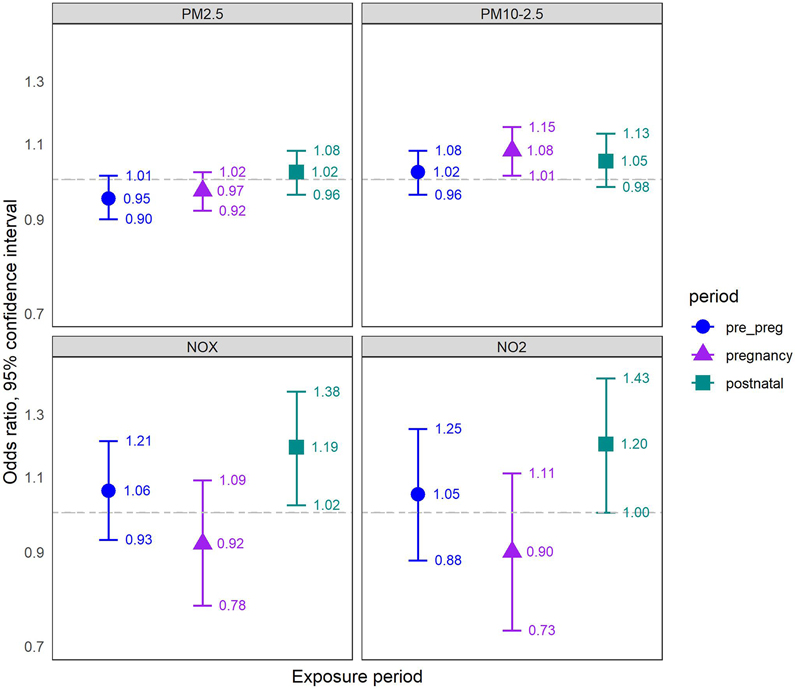
Figure 2. Air pollution - ASD Associations: Results of mutually adjusted logistic regression models.
Associations are presented as ORs (95% CI) per IQRw increase in air-pollutant concentrations for ASD, referring to IQRw of each pollutant exposure during pregnancy (2.55 μg/m3 for PM2.5, 6.79 μg/m3 for PM2.5-10, 11.7 ppb for NOx, 5.56 ppb for NO2). All models refer to a matched sample comprised of 3,843 cases and 38,430 controls (10 controls matched per one case, by year of birth), and are adjusted for year and calendar month of birth, population group, census-tract socioeconomic index, and wage; and mutually adjusted for pre-pregnancy, pregnancy and postnatal exposures. Pre_preg = pre-pregnancy exposure, 9 months before pregnancy; pregnancy = entire pregnancy exposure; postnatal = postnatal exposure, 9 months after birth; ORs = odds ratios; CI = Confidence interval; IQRw = interquartile range width; ASD = autism spectrum disorder.

