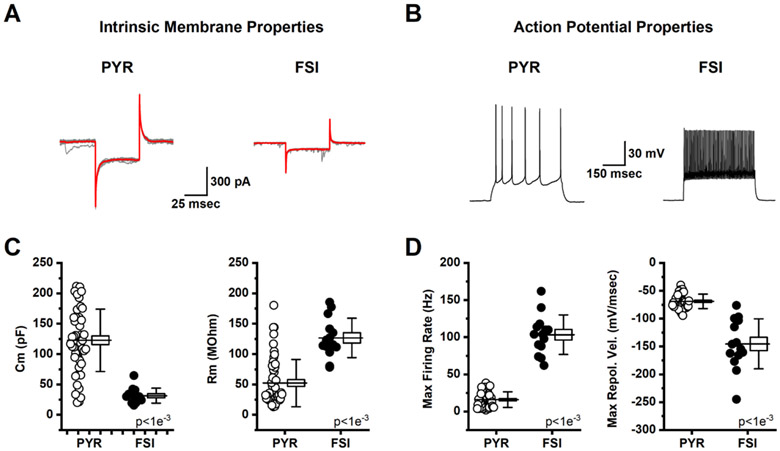
Fig. 3. Active and passive electrophysiological properties reliably distinguish pyramidal neurons from fast-spiking interneurons in the mPFC.
A: Representative traces from a pyramidal cell (PYR, left) and a fast-spiking interneuron (FSI, right) voltage clamped at −70 mV illustrate the response to a series of 50 msec voltage steps to −80 mV. Individual traces are illustrated in grey and the average trace for each cell is illustrated in red. Whole-cell capacitance and input resistance were calculated in each cell from these data as described in the methods. B: Sample data obtained in current clamp illustrating the response of a representative pyramidal cell (left) and fast-spiking interneuron (right) to a 300 pA x 500 msec current step. C: Summary data indicating that capacitance was significantly larger, and input resistance was significantly lower, in pyramidal cells (open circles) vs. fast-spiking interneurons (filled circles). D: Summary data indicating that the maximum firing rate achieved was lower, and that the maximum rate of repolarization from the action potential peak was slower, in pyramidal cells (open circles) vs. fast-spiking interneurons (closed circles). For box plots in C-D, the horizontal line through the middle of the box indicates the population mean, the box size indicates the standard error, and the whiskers indicate the standard deviation. Inset text provides p-values.

