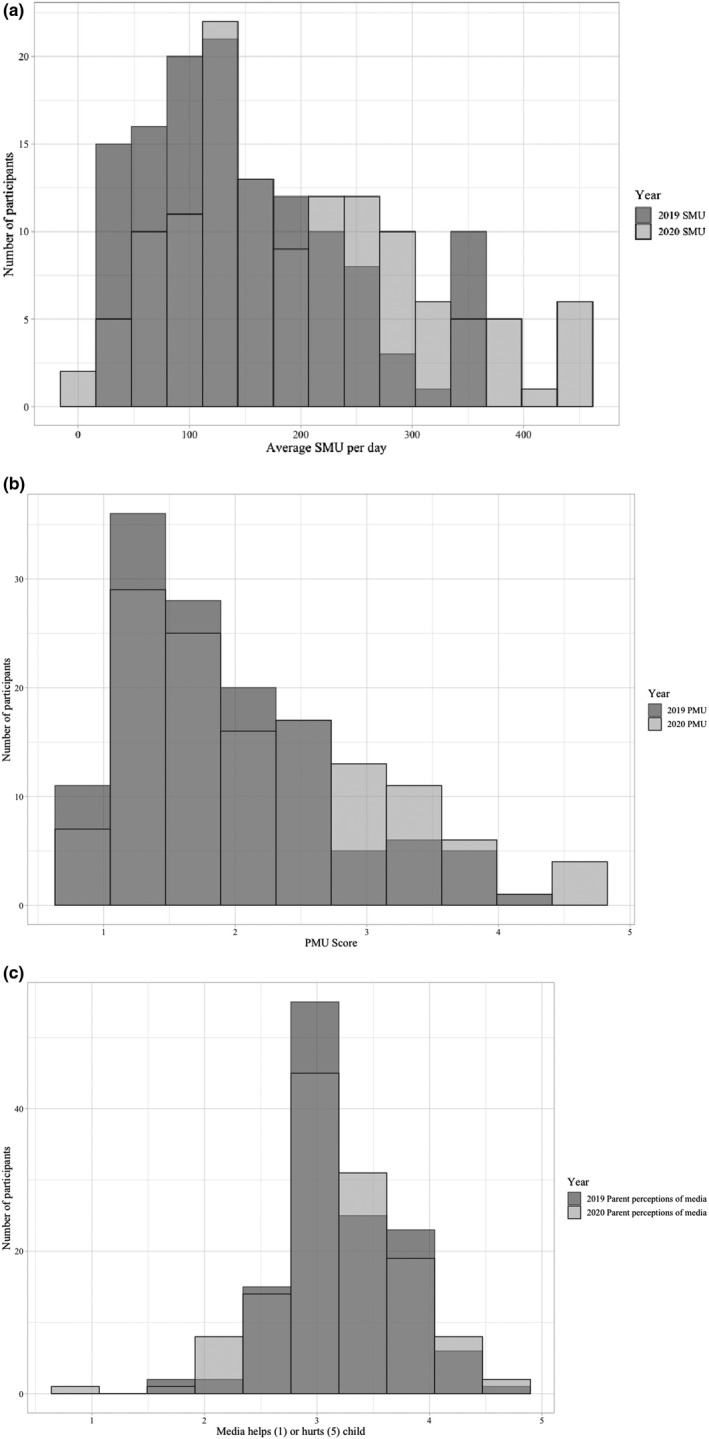
FIGURE 2.

(a) Average screen media use (SMU) per day in minutes in 2019 and 2020 (light gray bars indicate T2), (b) Average problematic media use (PMU) in 2019 and 2020 (light gray bars indicate T2), (c) Average parent perceptions of child media use (scale from 1 = helpful to 5 = hurtful) in 2019 and 2020 (light gray bars indicate T2)
