
Fig. 5.
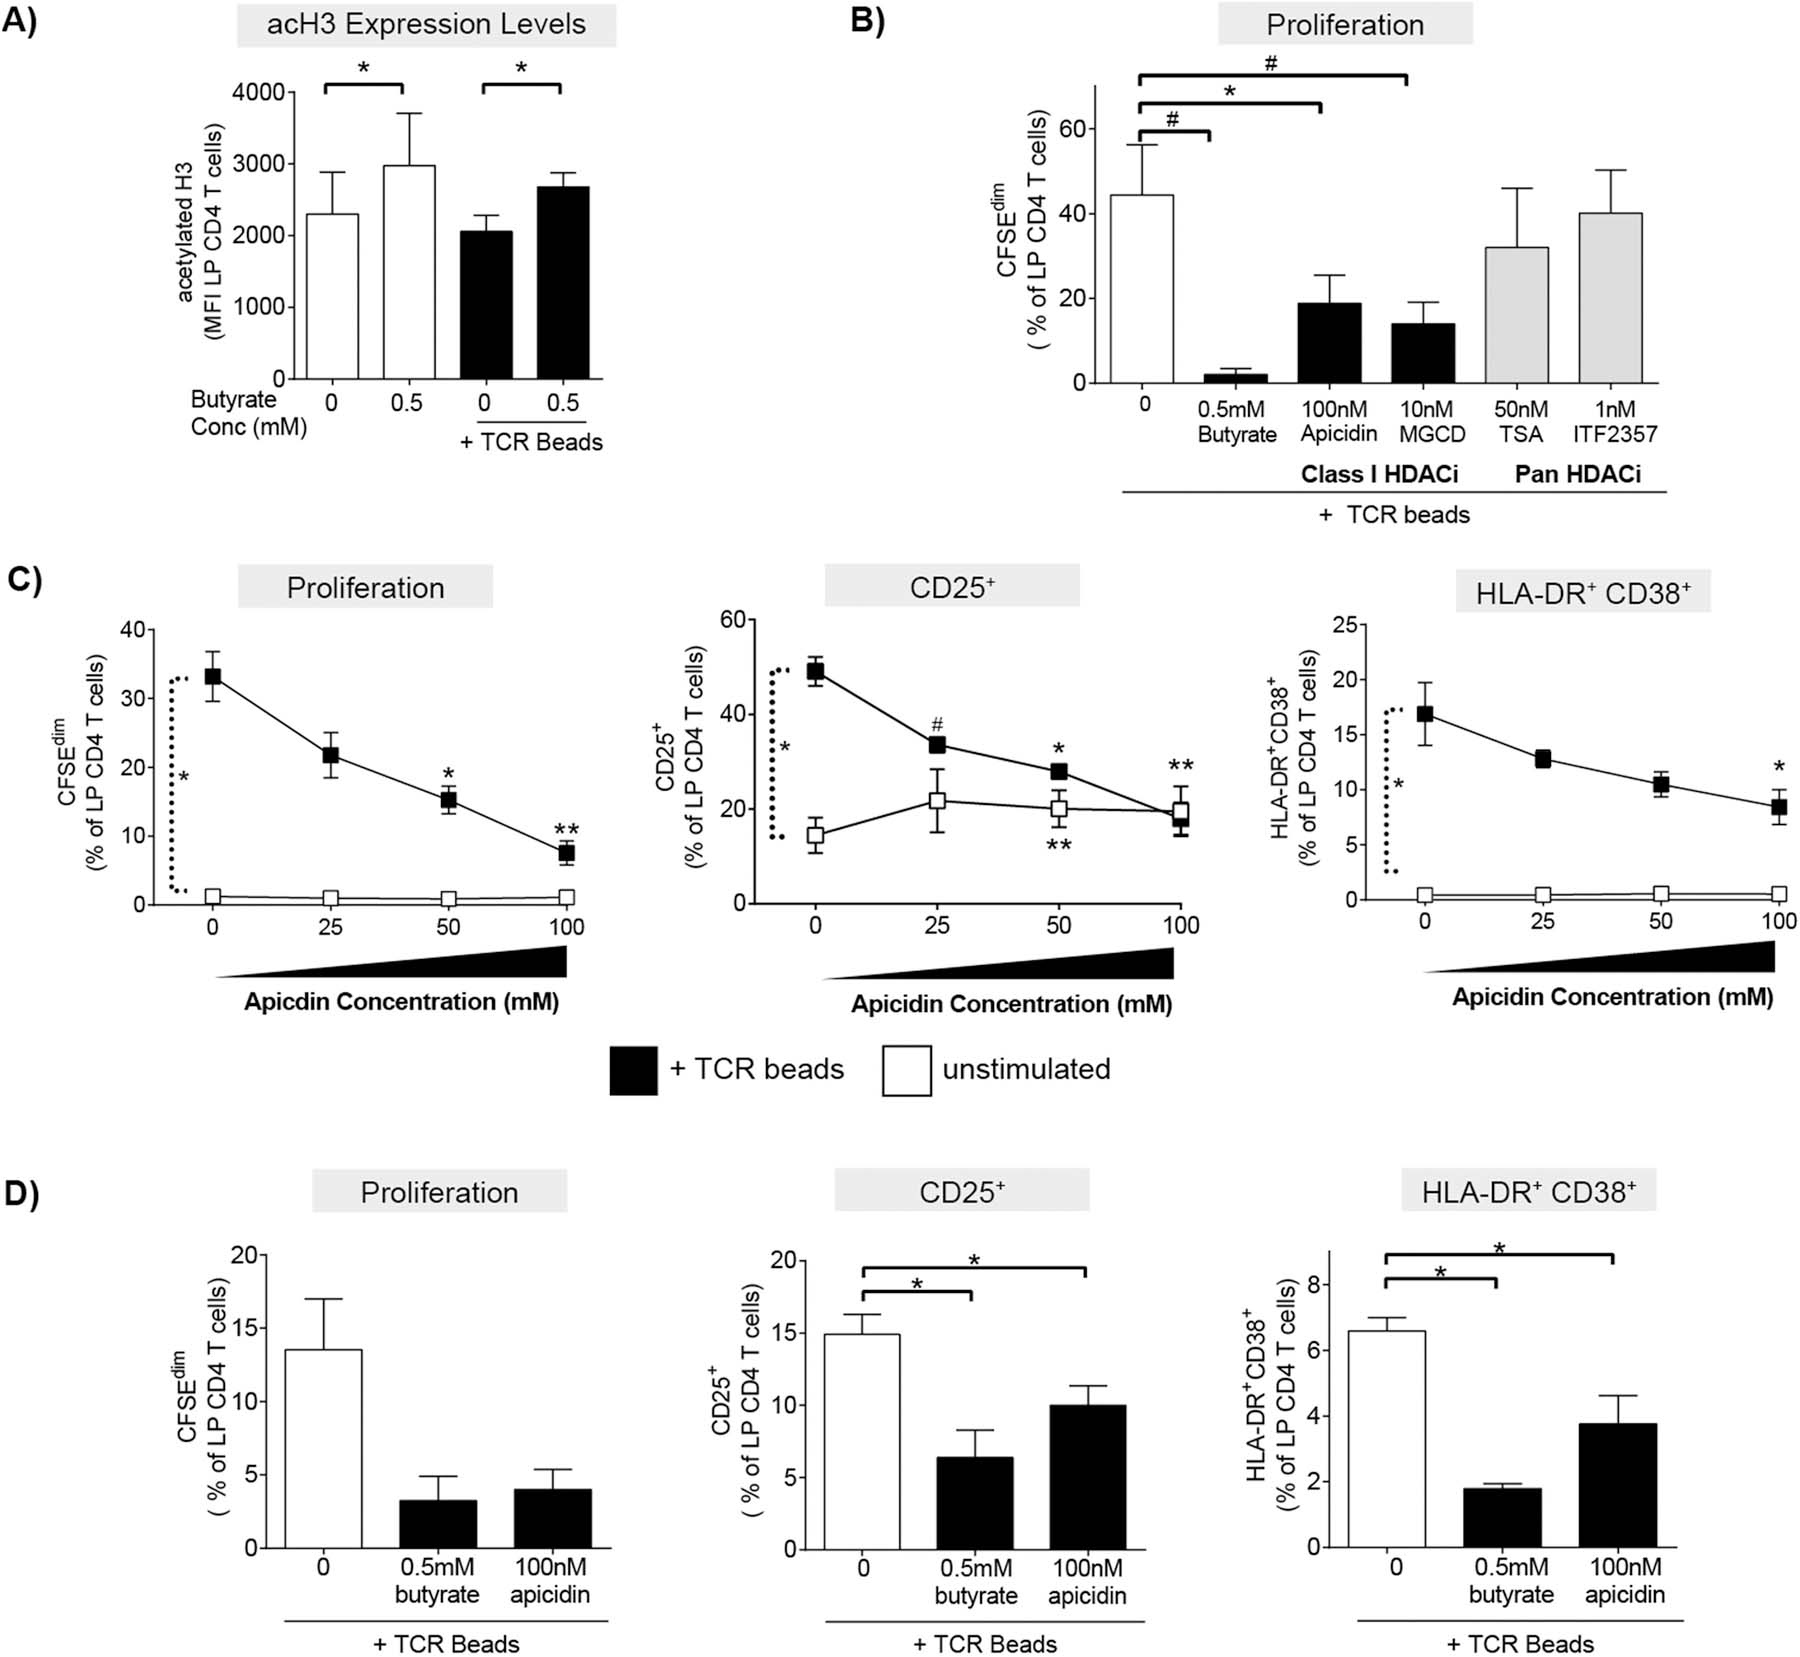
HDAC inhibitors phenocopy butyrate’s ability to decrease LP CD4 T cell proliferation and activation. (A) Levels of acetylation of histone 3 lysine 9 (H3K9) were measured in LP CD4 T cells by multi-color flow cytometry 24hrs after culture of LPMC (N = 4) in the presence or absence of exogenous butyrate (0.5 mM) and TCR-activating beads (TCR beads). Values are shown as the mean fluorescence intensity (MFI) of acetylation of H3K9 (acetylated H3) (mean ± SEM). Statistical analysis: Paired t-tests were conducted to determine differences in acetylation of H3K9 levels in LP CD4 T cells in the presence or absence of butyrate in unstimulated or TCR bead-stimulated conditions. *P < 0.05. (B) CFSE-labelled LPMC (N = 3) were exposed to TCR beads and Class I specific HDAC inhibitors (HDACi’s; apicidin and MGCD) or pan HDACi’s (TSA and ITF2357) and levels of LP CD4 T cell proliferation (CFSEdim) determined at 4 days using multi-color flow cytometry. Values are shown as mean ± SEM. Statistical analysis Paired t tests were conducted to determine differences in proliferation between TCR bead-stimulated LPMC in the absence of butyrate (open bar) and in the presence of butyrate or HDAC inhibitors (filled bars). *P < 0.05, #P ≤ 0.07. (C) LPMC (N = 3) or (D) purified LP CD4 T cells (N = 3) were cultured with or without TCR beads and Apicidin (25‒100 nM) for four days and percentages of LP CD4 T cells that proliferated (CFSEdim) or expressed CD25 or HLA-DR+CD38+ determined using multi-color flow cytometry. FM2 (Fluorescence minus two; HLA-DR and CD25) and isotype control (CD38) values have been subtracted. Values are shown as mean ± SEM. Statistical analysis: Paired t tests were conducted to determine differences in proliferation or activation between no stimulated and TCR bead-stimulated conditions and between butyrate or apicidin concentrations versus no butyrate/apicidin conditions in the presence or absence (C only) of TCR beads. *P < 0.05, **P < 0.01, #P ≤ 0.07.