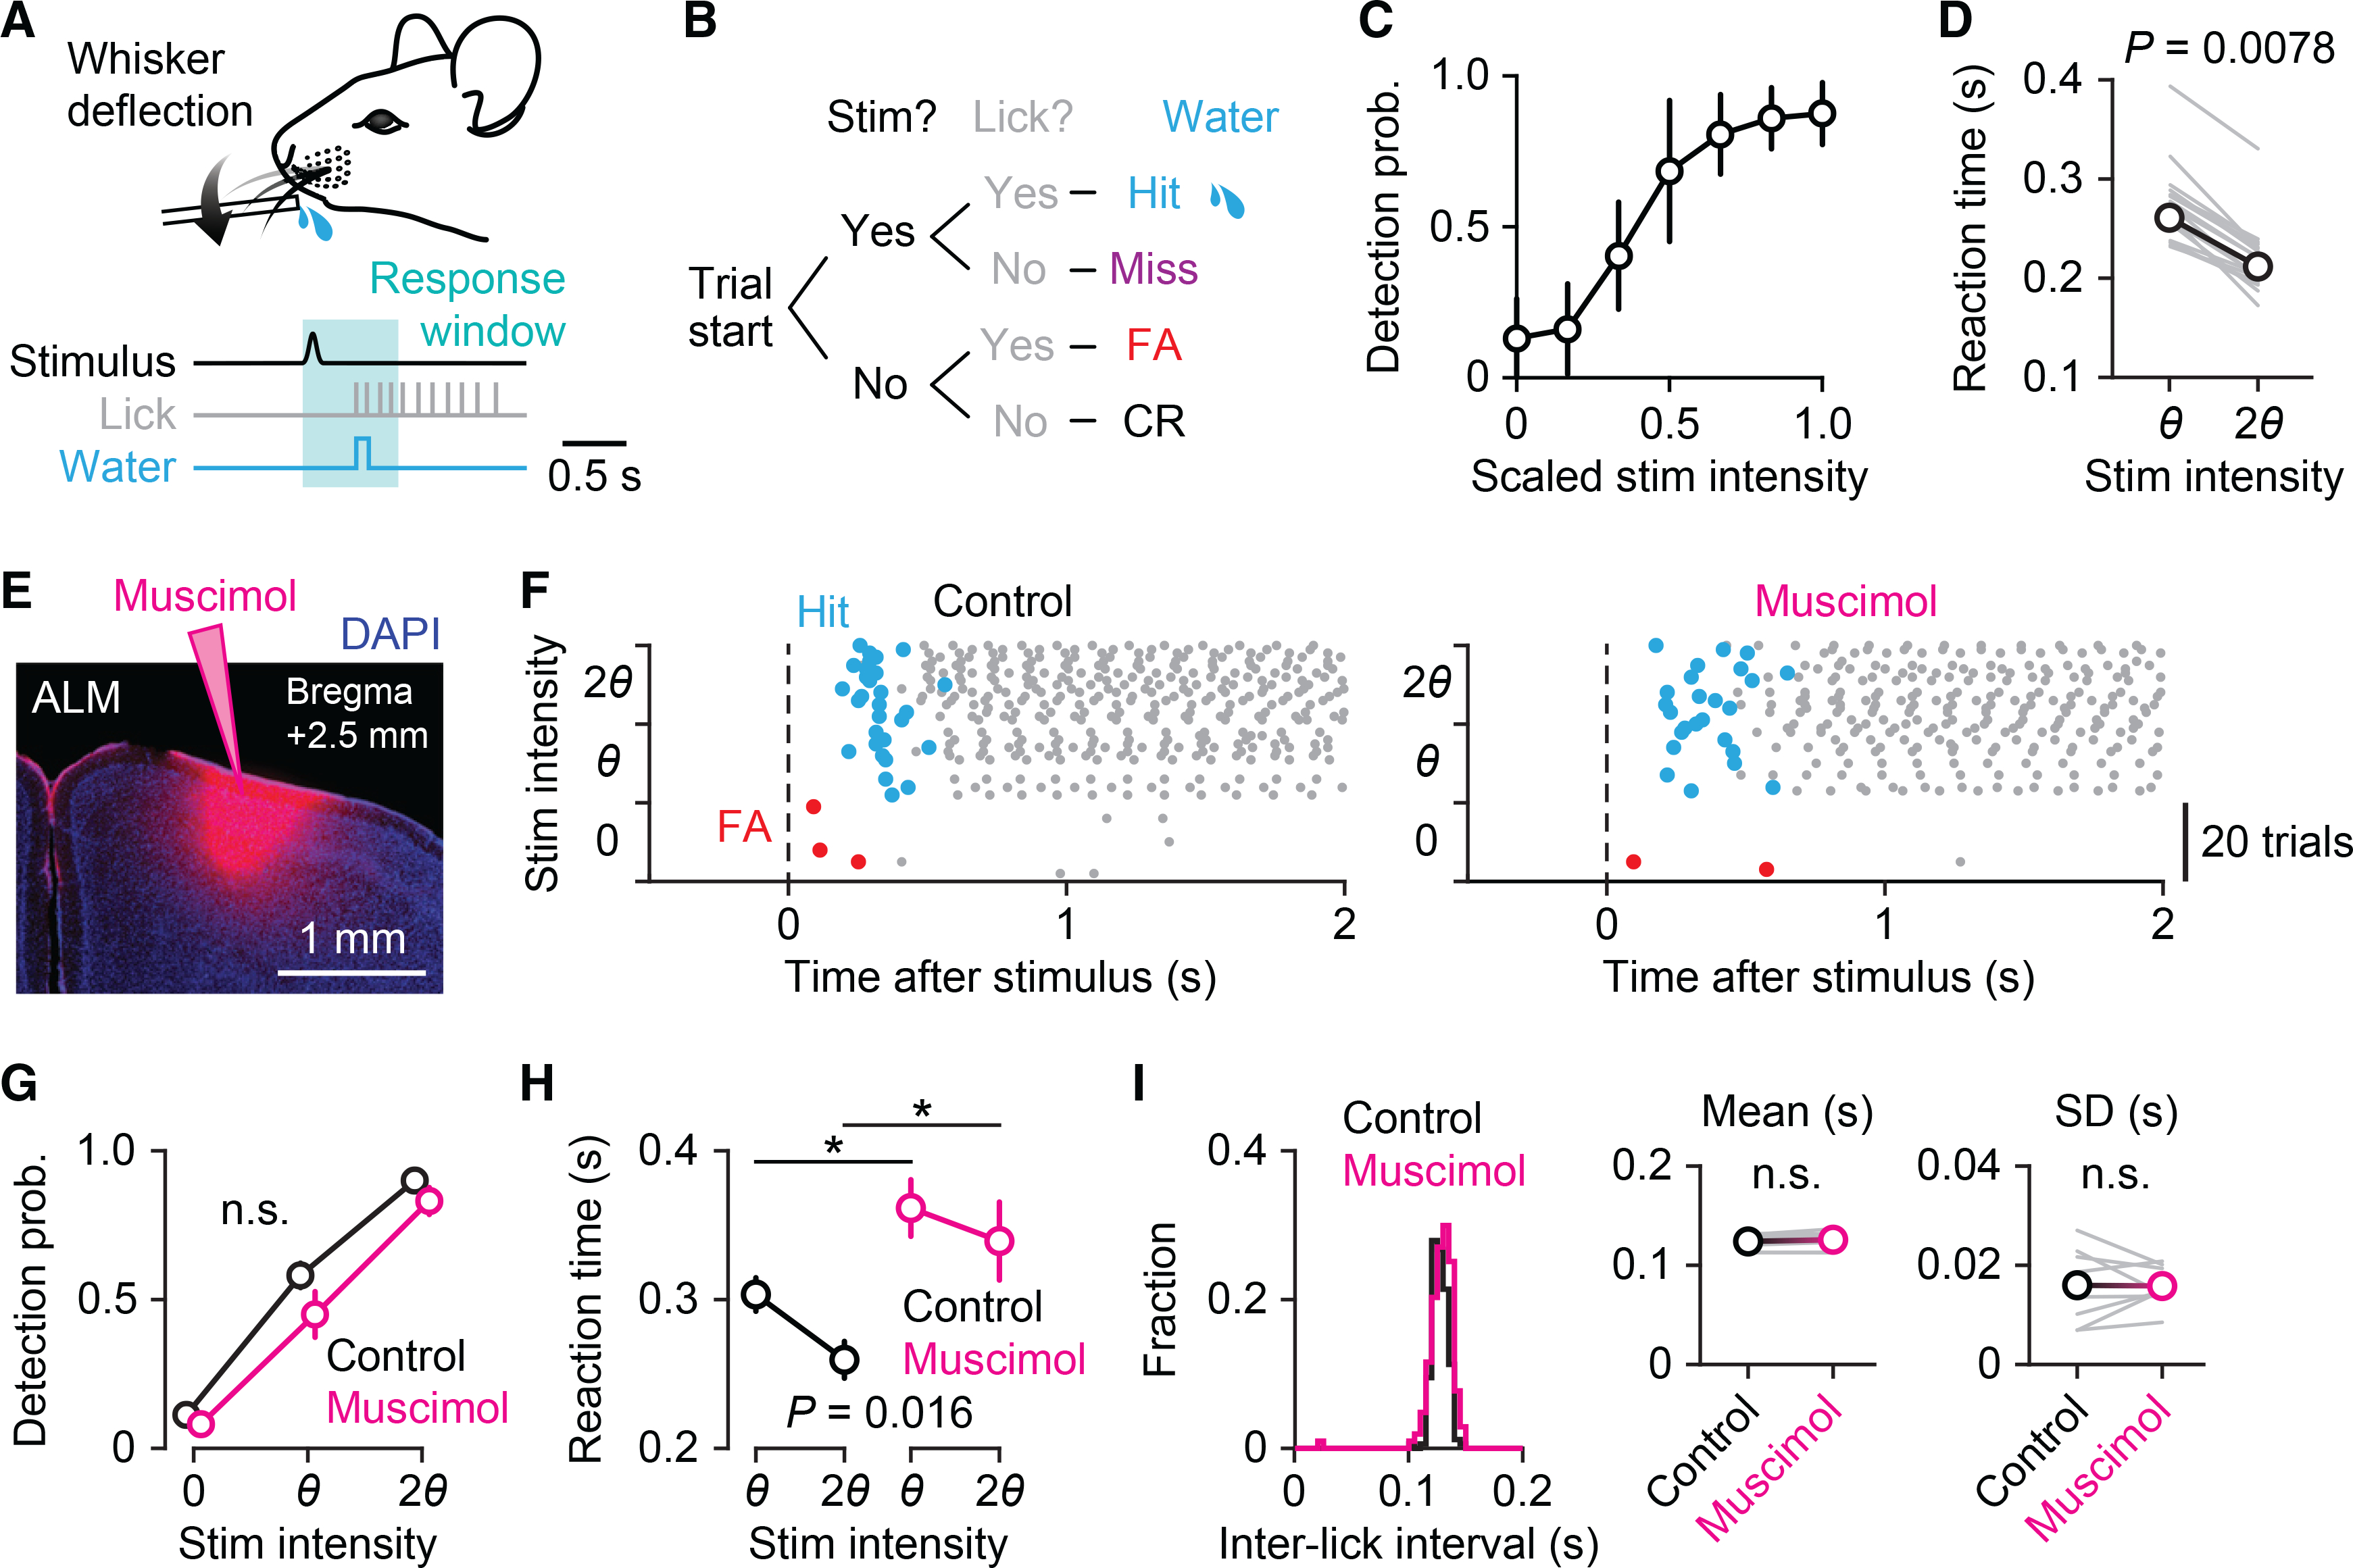
Figure 1. ALM is involved in lick initiation in a cued licking task.

(A) Behavioral task design. Mice were trained to detect whisker deflections and lick a spout to obtain water rewards.
(B) Block diagram of the sequence of events for a single trial. Behavioral outcomes were classified into hit, miss, false alarm (FA), and correct rejection (CR).
(C) Psychometric function averaged across sessions (n = 20 sessions from four mice, mean ± SD).
(D) Reaction times for threshold (θ) and salient (twice the threshold intensity, 2θ) stimuli (n = 18 sessions from six mice; Wilcoxon signed-rank test). The gray lines represent individual sessions, and the black line represents the average.
(E) Site of infusion and diffusion of unilateral muscimol injection in ALM.
(F) Raster plot showing lick responses (gray dots) throughout a representative behavioral session before (left) and after (right) muscimol injection. The three stimulus types (catch, 0; threshold stimulus, θ; salient stimulus, 2θ) are randomly presented during the session but grouped here for plotting. Hit (rewarded) licks and FA licks are marked in blue and red, respectively.
(G–I) Behavioral comparisons before (black) and after (magenta) muscimol injection. (G) Detection probability (n = 8 sessions from four mice, mean ± SEM; p = 0.13, two-way repeated-measure ANOVA). (H) Reaction times for threshold and salient stimuli (n = 8 sessions from four mice, mean ± SEM; two-way repeated-measure ANOVA with Tukey-Kramer post hoc comparisons, *p = 0.046 for θ; *p = 0.018 for 2θ). (I) Histograms of inter-lick intervals in an example session (left). Insets: means (middle) and SDs (right) of inter-lick intervals (n = 8 sessions from four mice; p = 0.10 for means, p = 0.94 for SDs, paired t test).
See also Figure S1.
