
Figure 2. Transient activation of thalamocortical inputs in ALM coincides with lick initiation.
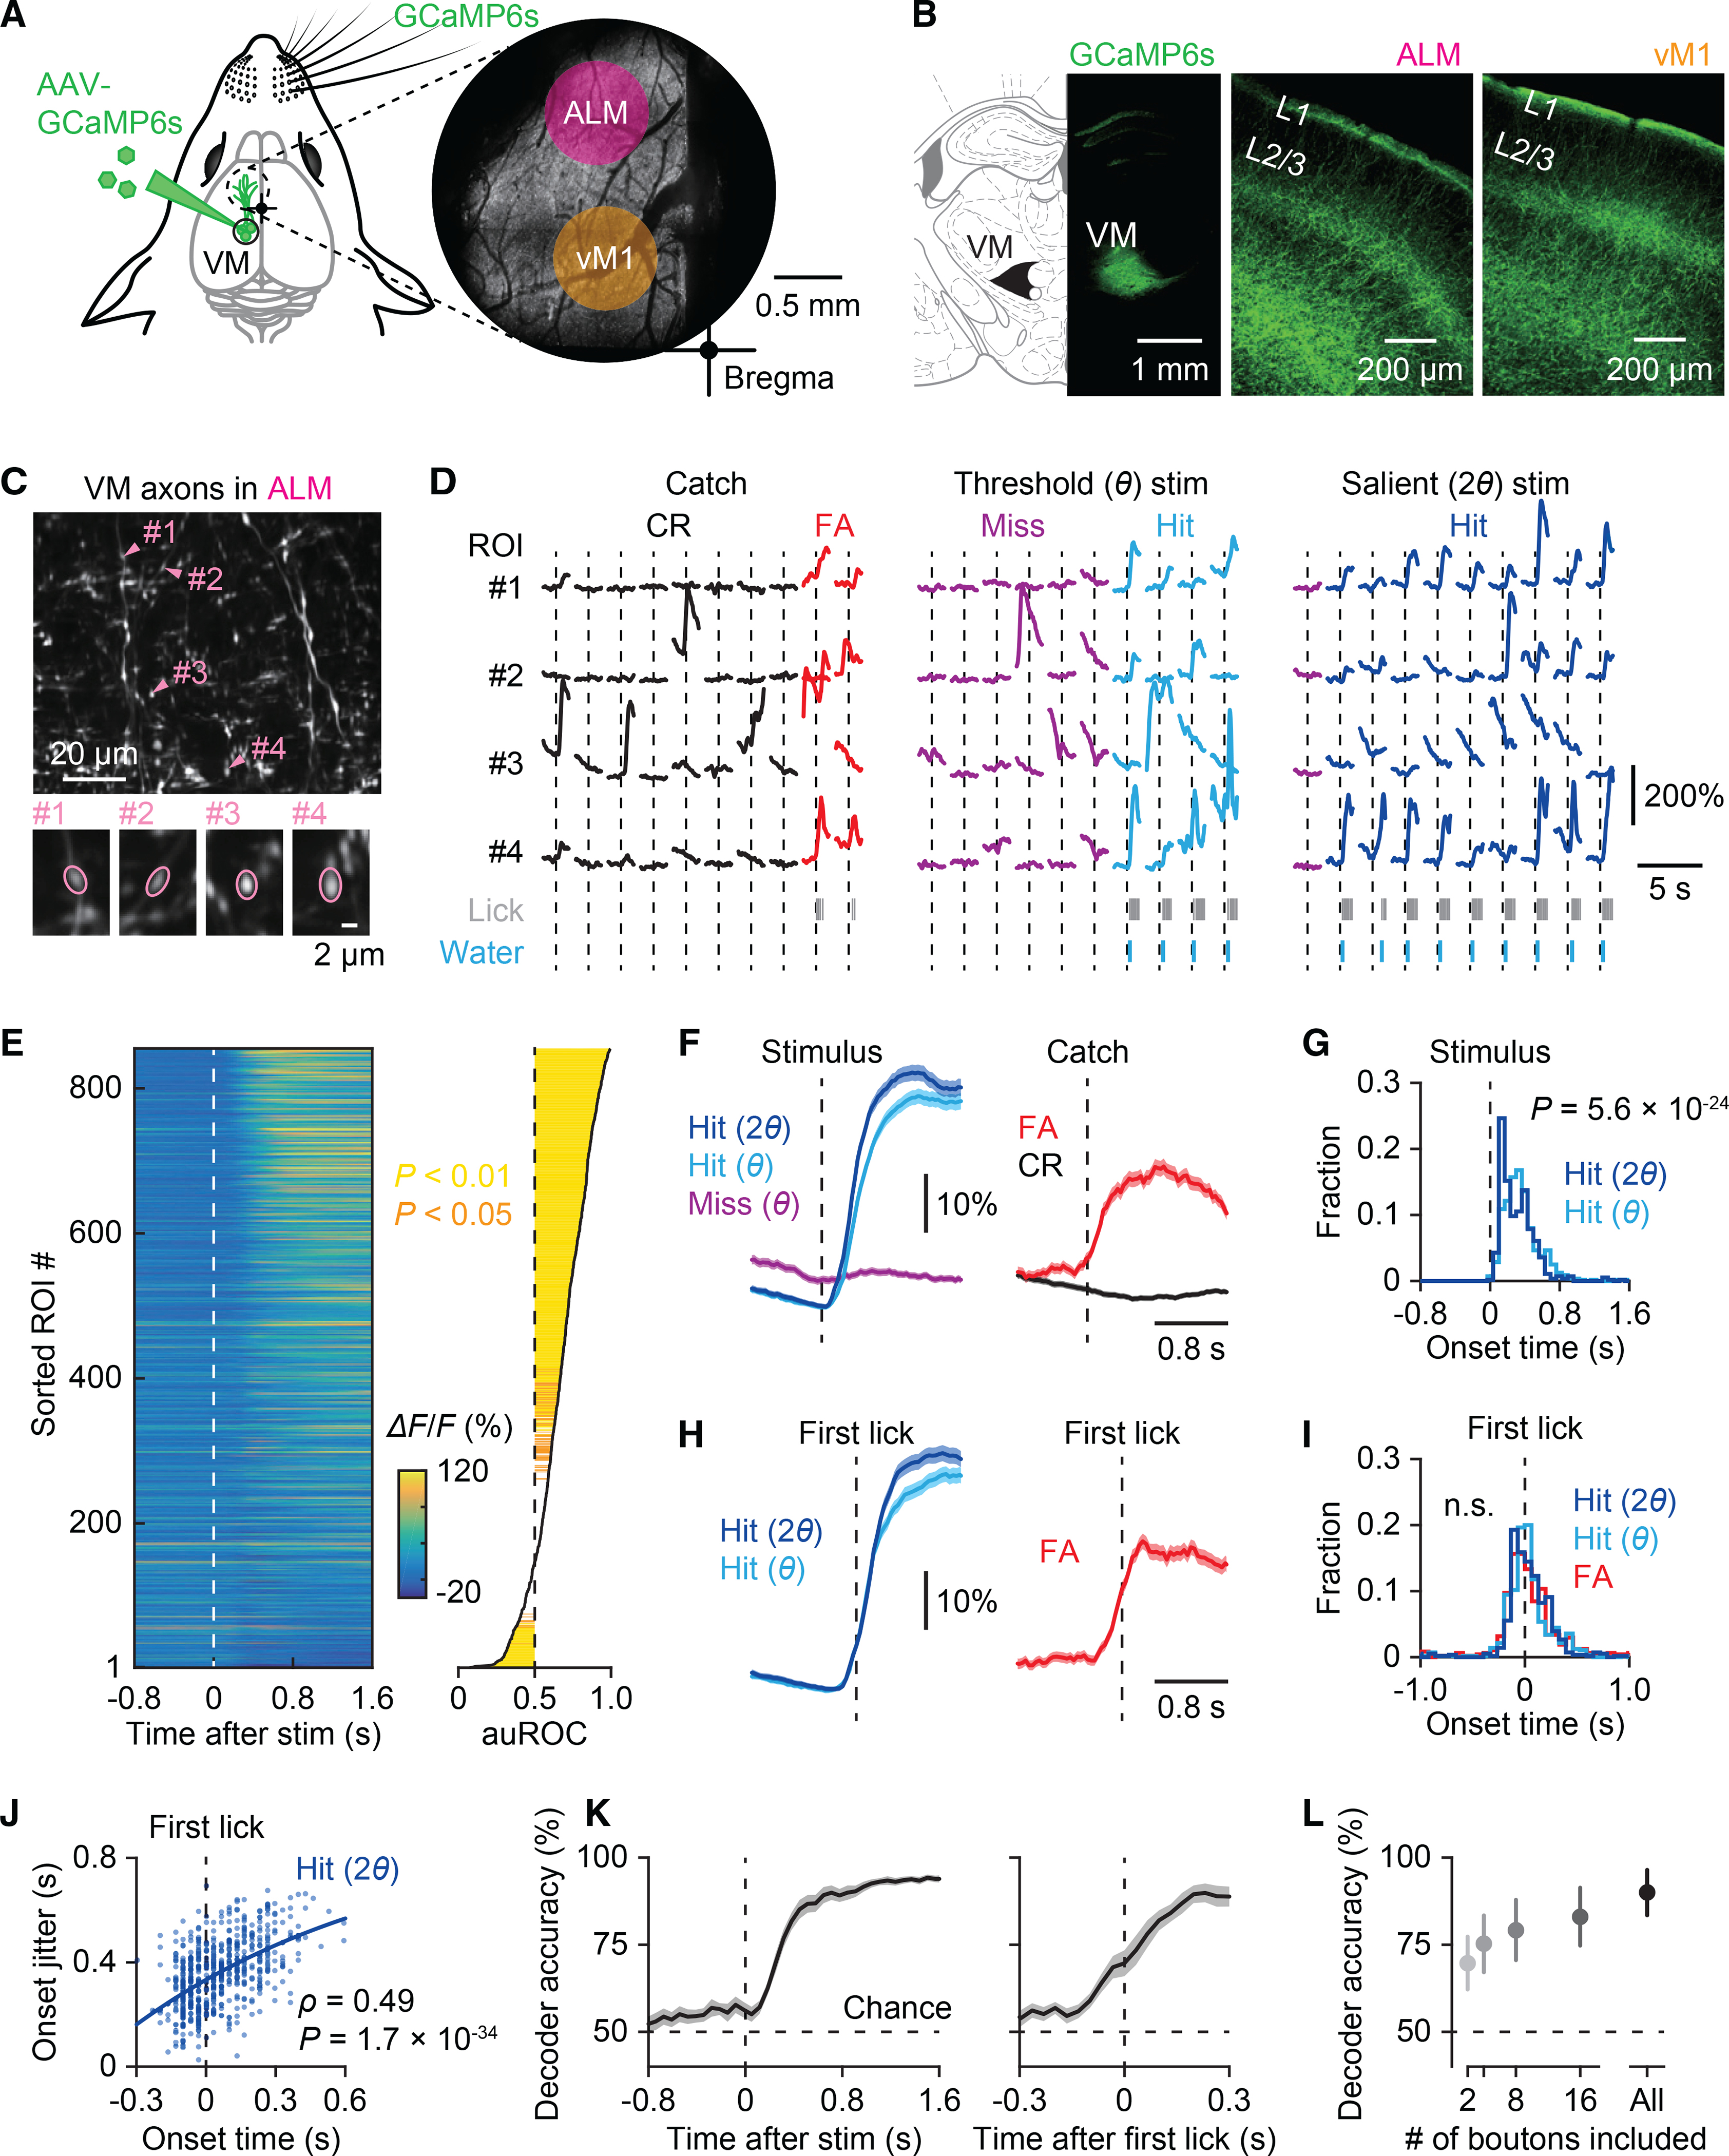
(A) Left: Schematic of injection of AAV-GCaMP6s in the VM thalamus. Right: Two-photon image of GCaMP6s-expressing VM axons in L1 in the frontal motor areas through a chronic window.
(B) GCaMP6s expression in VM (left) and their axonal fibers in ALM (middle) and vM1 (right).
(C) Top: Two-photon image of a representative field of view showing VM axons in ALM. Bottom: Example axonal boutons indicated in the top panel.
(D) Example Ca2+ traces from the four boutons marked in (C) in catch (no stimulus) trials (left) and cued trials with threshold (θ; middle) or salient stimuli (2θ; right) (10 trials for each stimulus type). Trials were separated based on the animal’s response; false alarm (FA) versus correct rejection (CR) for catch trials and hit versus miss for cued trials.
(E) Left: Ca2+ signals averaged across hit trials in response to threshold whisker stimuli. Right: Hit versus miss response strength of each bouton, calculated as the area under the ROC curve (auROC) (see STAR Methods). Boutons were sorted by auROC. Statistical significance is indicated in colors.
(F) Left: Ca2+ responses to salient stimuli and threshold stimuli in hit trials versus threshold stimuli in miss trials for axonal boutons that were positively correlated with behavior (*auROC > 0.5, p < 0.05) (n = 560 boutons, mean ± SEM). Right: Ca2+ activity associated with false alarm (red) versus correct rejection (black) in catch trials.
(G) Histogram of onset timings of Ca2+ responses in hit trials (n = 560 boutons; Wilcoxon singed-rank test).
(H) Ca2+ responses of axonal boutons with *auROC > 0.5 aligned by the timing of the first lick in hit (left) and false alarm trials (right) (n = 560 boutons, mean ± SEM).
(I) Histogram of onset timings of Ca2+ responses aligned by the first lick in hit and false alarm trials (n = 560 boutons for hit trials and 473 boutons for false alarm trials; p = 0.47, Kruskal-Wallis test).
(J) Correlation between the mean onset timing and the jitter (standard deviation) of Ca2+ responses aligned by the first lick in hit trials with salient stimuli (n = 554 boutons; Spearman’s rank correlation). Each dot represents an axonal bouton with *auROC > 0.5.
(K) Left: Performance of a linear population classifier in decoding behavioral outcomes based on VM axonal activity (n = 10 sessions, mean ± SEM). Right: Decoder performance before and after the first lick (n = 10 sessions; p = 4.9 × 10⁻⁴ at 0 s, paired t test).
(L) Classifier performance at the end of the response time window (0.7 s after the stimulus) as a function of the number of boutons used to train decoders (n = 10 sessions, mean ± SD).
See also Figure S2.