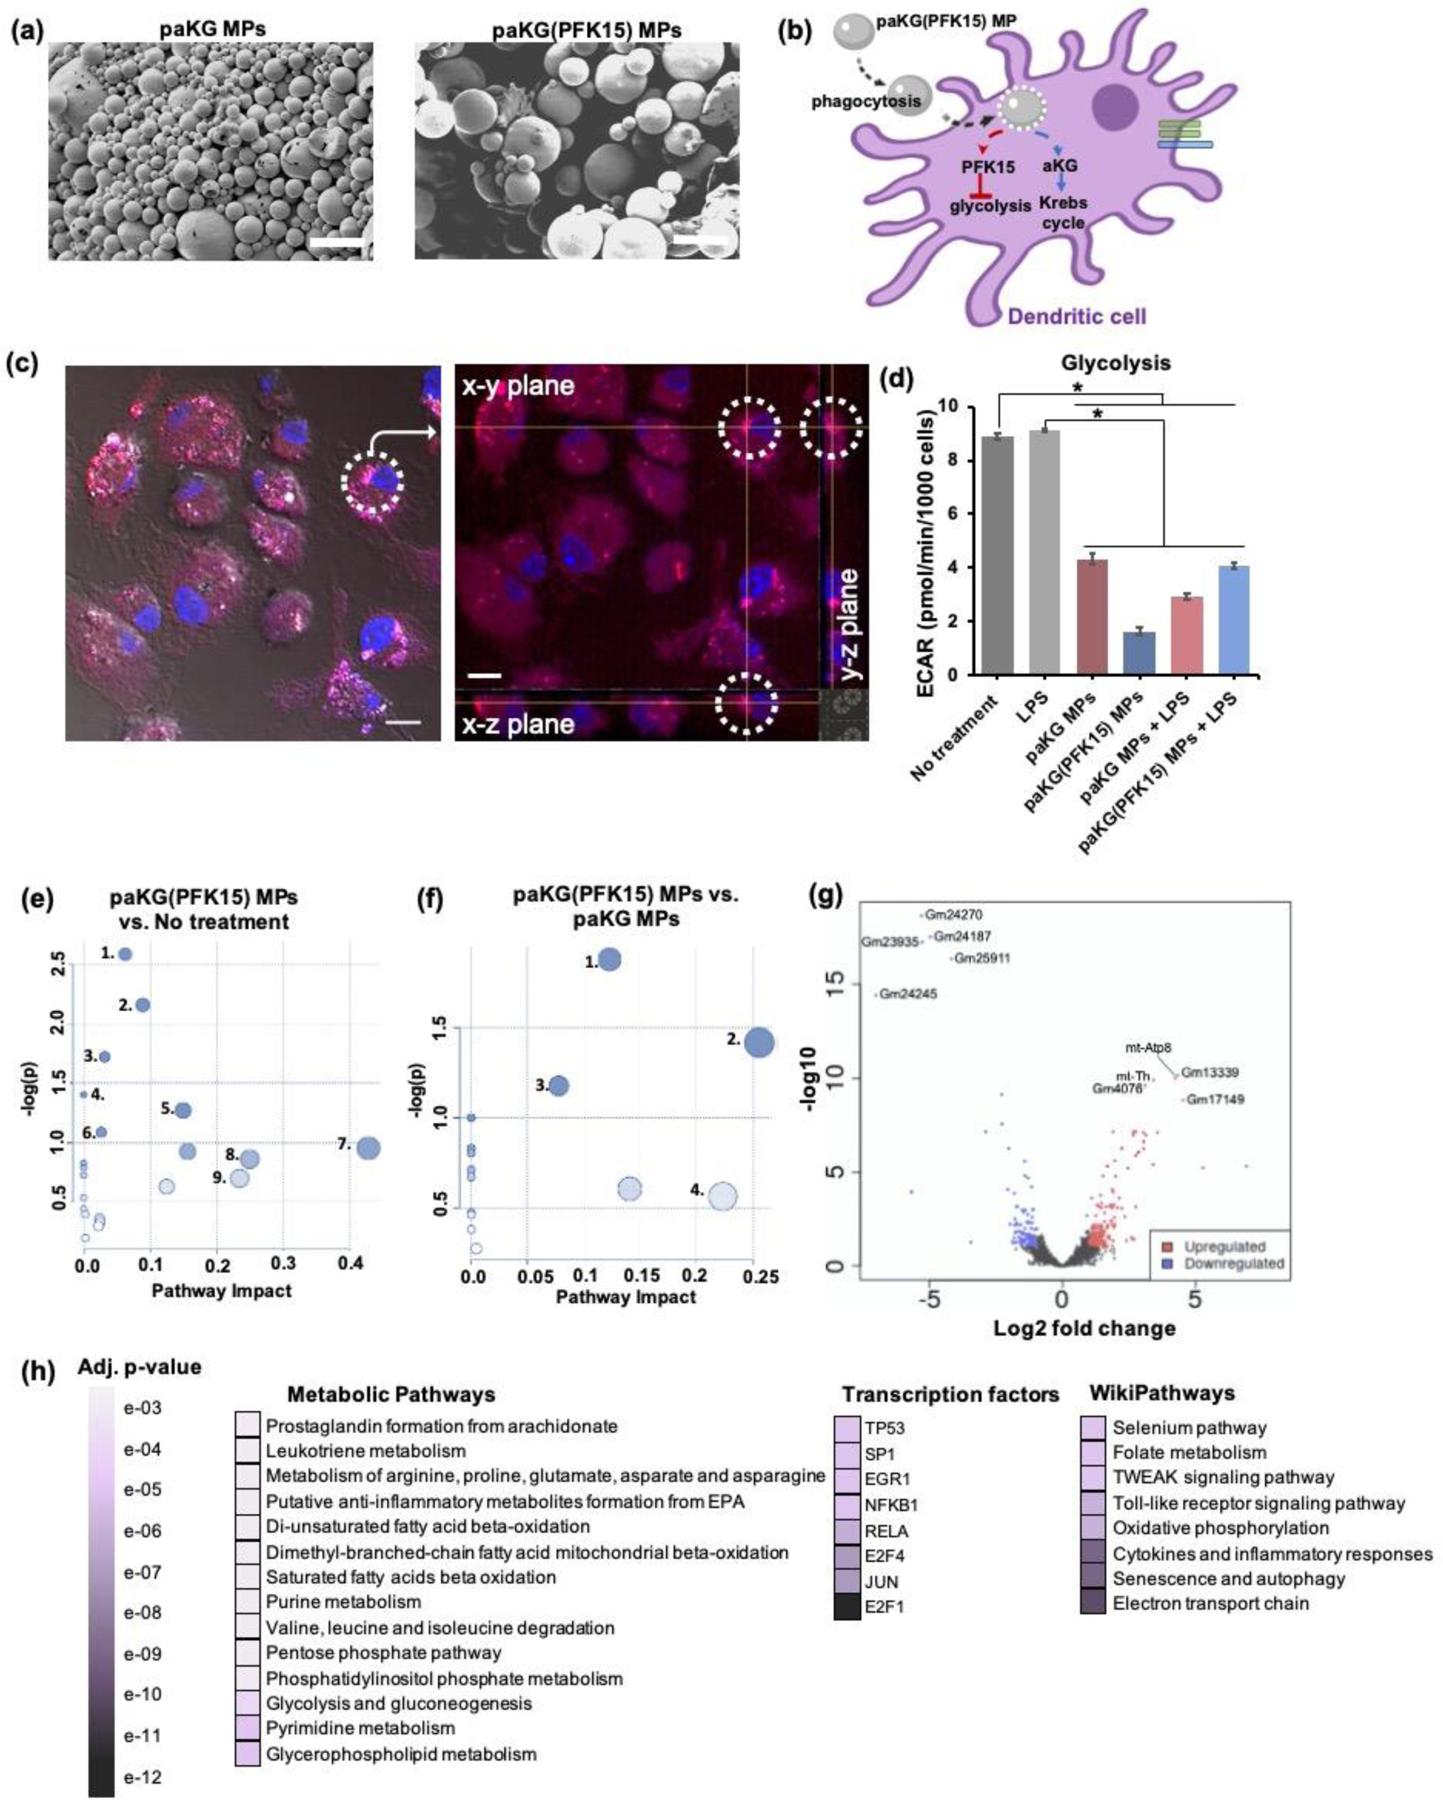
Figure 2: paKG(PFK15) MPs modulate the metabolic profile of BMDCs in vitro.

(a) SEM of paKG MPs and paKG(PFK15) MPs demonstrate spherical and heterogenous MPs (scale bar = 10 μm, magnification 2000x). (b) Schematic of paKG(PFK15) MPs modulating BMDC metabolism. (c) BMDCs phagocytose paKG MPs (paKG MP – red, nucleus – blue; gray = DIC filter, scale bar = 10 μm). The dashed circle and crossbar (yellow lines meet), in the right image, shows the same particle in different planes (x,y,z). (d) In the presence of LPS, paKG(PFK15) MPs significantly reduced the glycolysis (ECAR) in BMDCs as compared to LPS alone (n = 15–18, avg ± SEM, * - p<0.05.) (e, f) Metabolomics of BDMCs, (e) paKG(PFK15) MPs significantly modulate 28 intracellular metabolite levels and their respective signaling pathways, significantly as compared to no treatment. paKG(PFK15) MPs vs. no treatment: 1 – Citrate cycle; 2 – Alanine, asparate and glutamate metabolism; 3 – Butanoate metabolism; 4 – Pyruvate metabolism; 5 – Glycolysis/gluconeogenesis; 6 – Cysteine and methionine metabolism; 7 – Taurine and hypotaurine metabolism; 8 – Ascorbate and alderate metabolism; 9 – Nicotinate and nicotinamide metabolism, (f) paKG(PFK15) MPs significantly modulated 34 intracellular metabolite levels significantly as compared to paKG MPs. paKG(PFK15) MPs vs. paKG MPs: 1 – Histidine metabolism; 2 – Glutathione metabolism; 3 – Arginine and proline metabolism; 4 – Alanine, asparate and glutamate metabolism. Pathway impact – number of metabolites modified significantly in a pathway; -log(p) – level of modulation (n = 3, p<0.05). (g, h) RNA-seq of BMDCs, (g) a volcano plot of RNA-seq results display the fold changes (log2 fold change) and the false discovery rate (FDR)-adjusted p values (-log10 (FDR)) in genes that were upregulated (red) and downregulated (blue) when comparing paKG(PFK15) MP treated BMDCs to no treatment, (h) a gene enrichment map is represented by the statistical significance (FDR-adjusted p value) of enriched pathways. The darker purple colors represent higher significant differences between paKG(PFK15) MPs and no treatment (n = 3).
