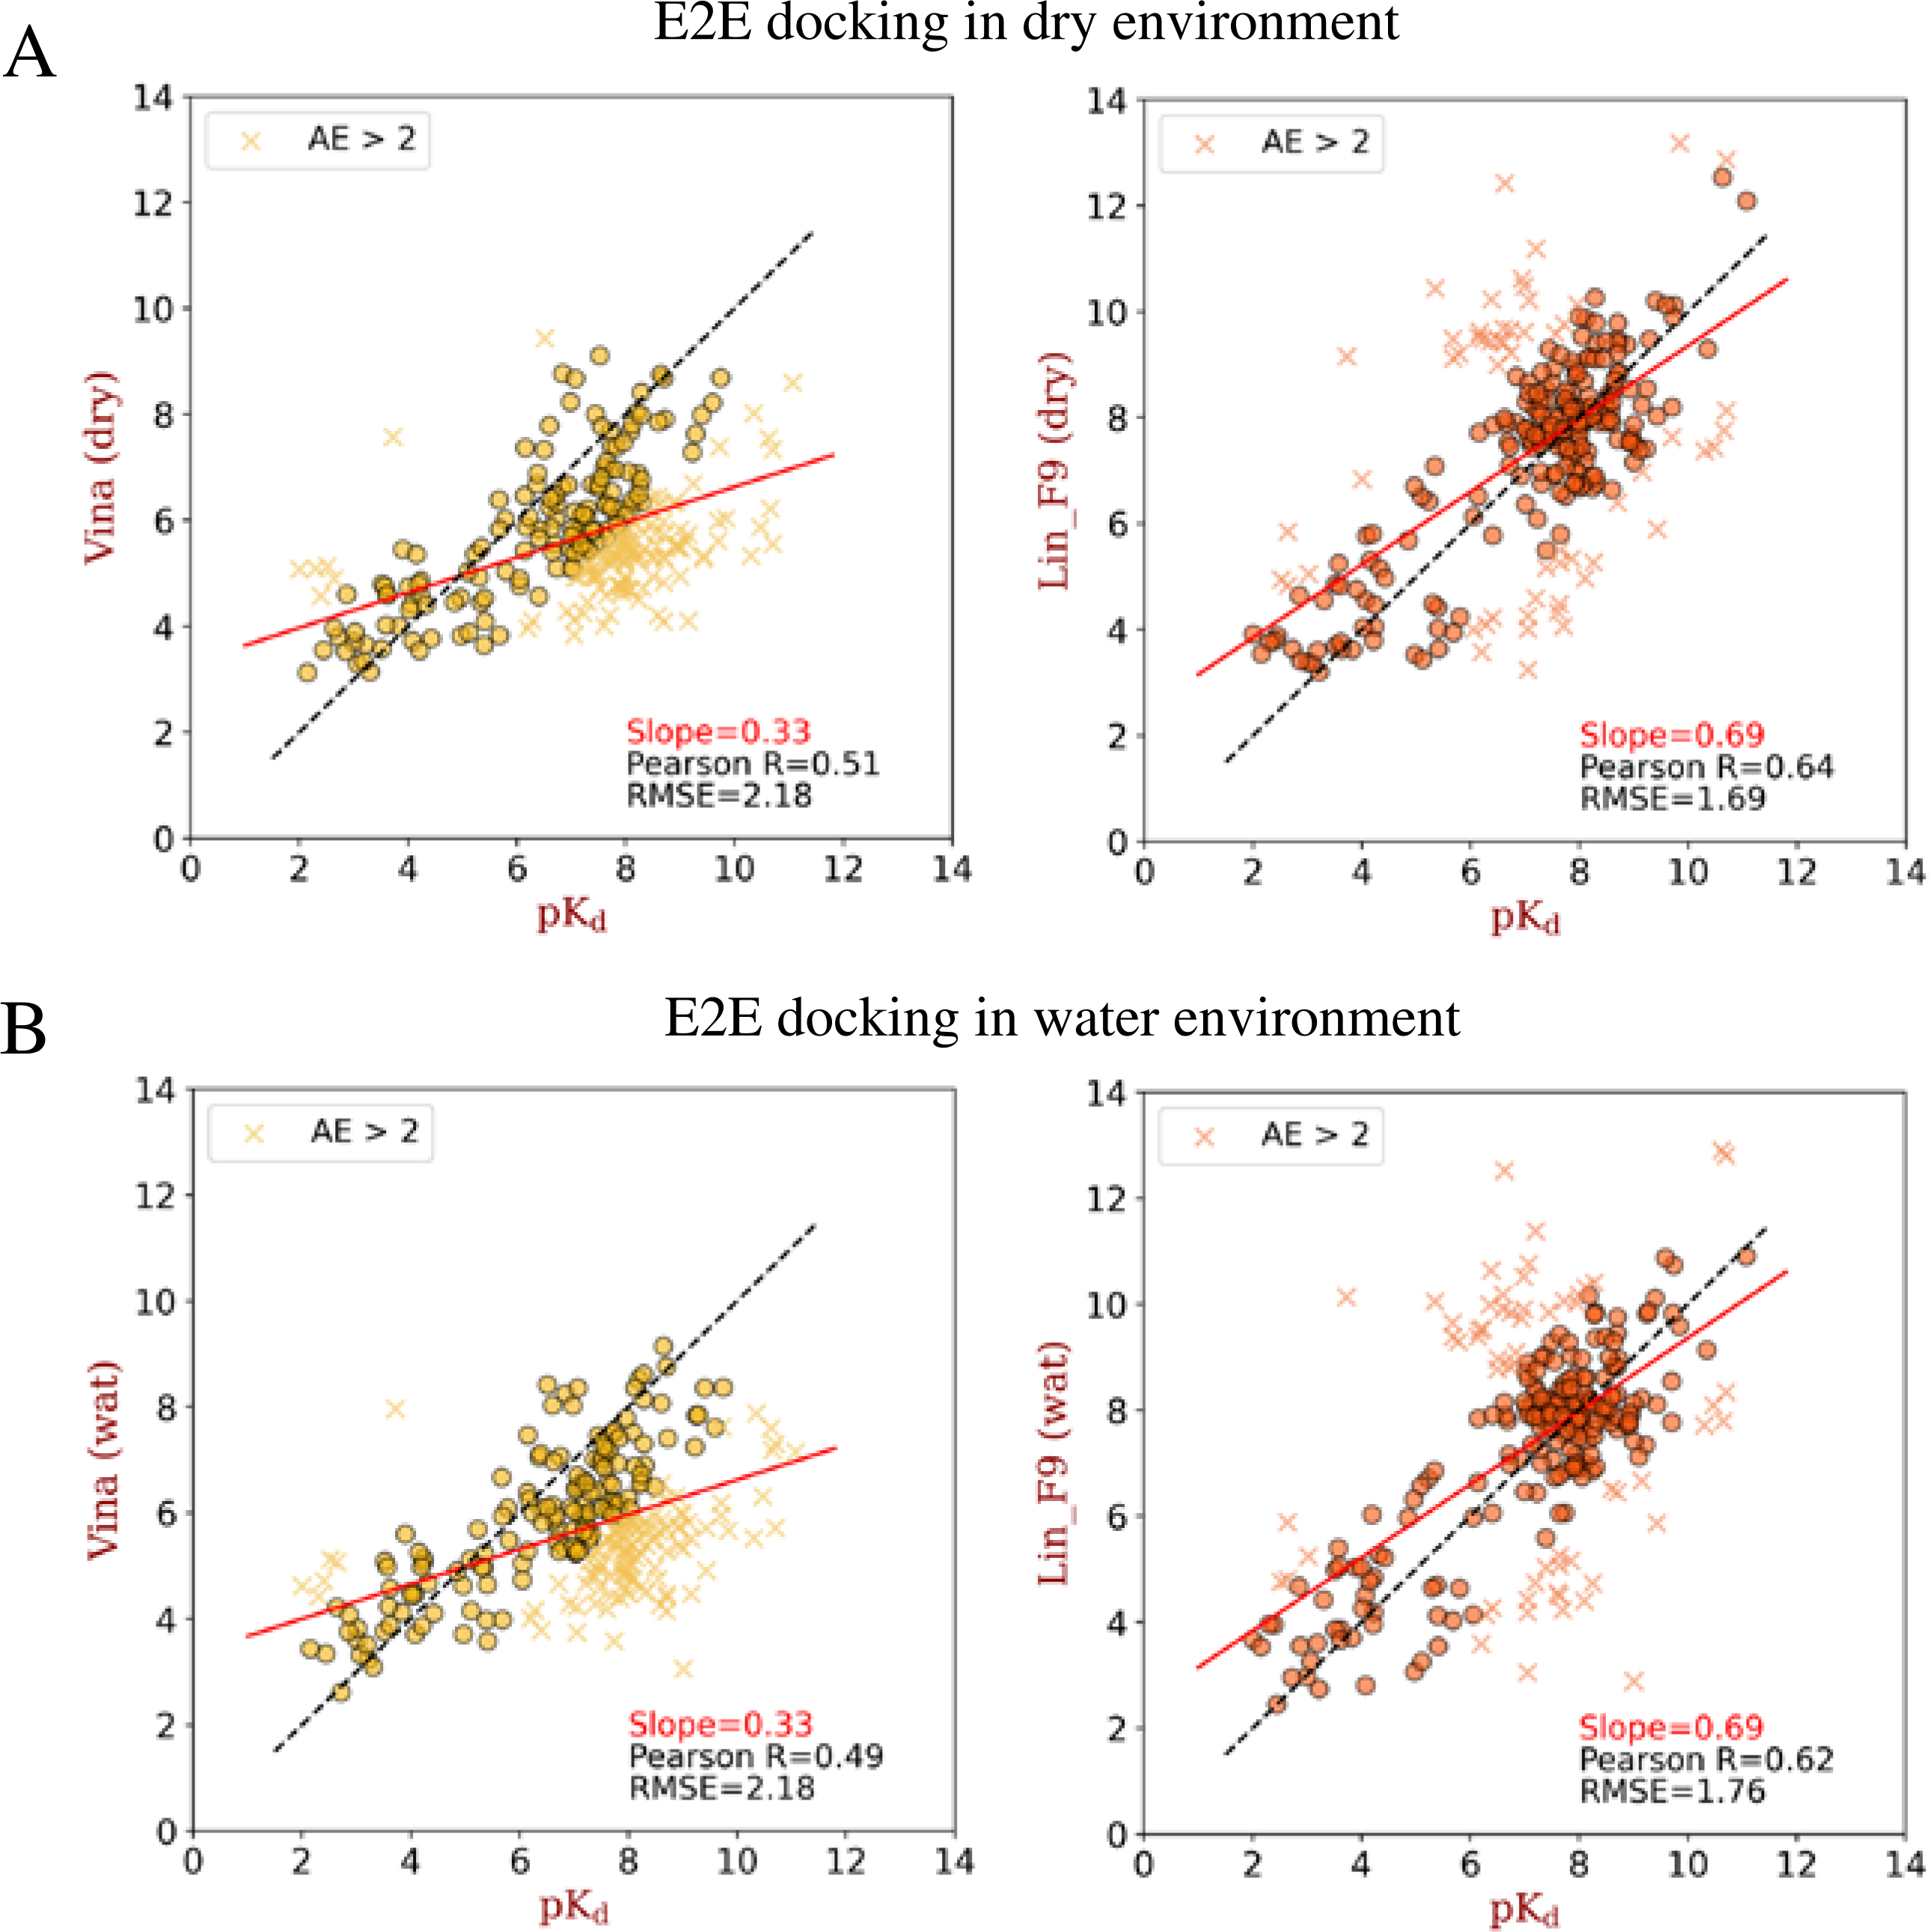
Figure 10.

Scatter plots between experimental pKd and E2E docking predicted pKd (by Vina or Lin_F9) on metalloprotein test set. (A) E2E docking in dry environment and (B) E2E docking in water environment. The absolute error in pKd larger than 2 are plotted with marker “x”, and others are plotted with marker “o”. The solid red line for each plot corresponds to the linear fit between predicted scores and experimental pKd, the slope value for this linear fit is shown in the plot. Also, Pearson correlation coefficient and root-mean-square error between predicted scores and experimental pKd are shown for each plot.
