
Figure 3. #11a, CF3CN and their mixture inhibit AEP in primary neurons.
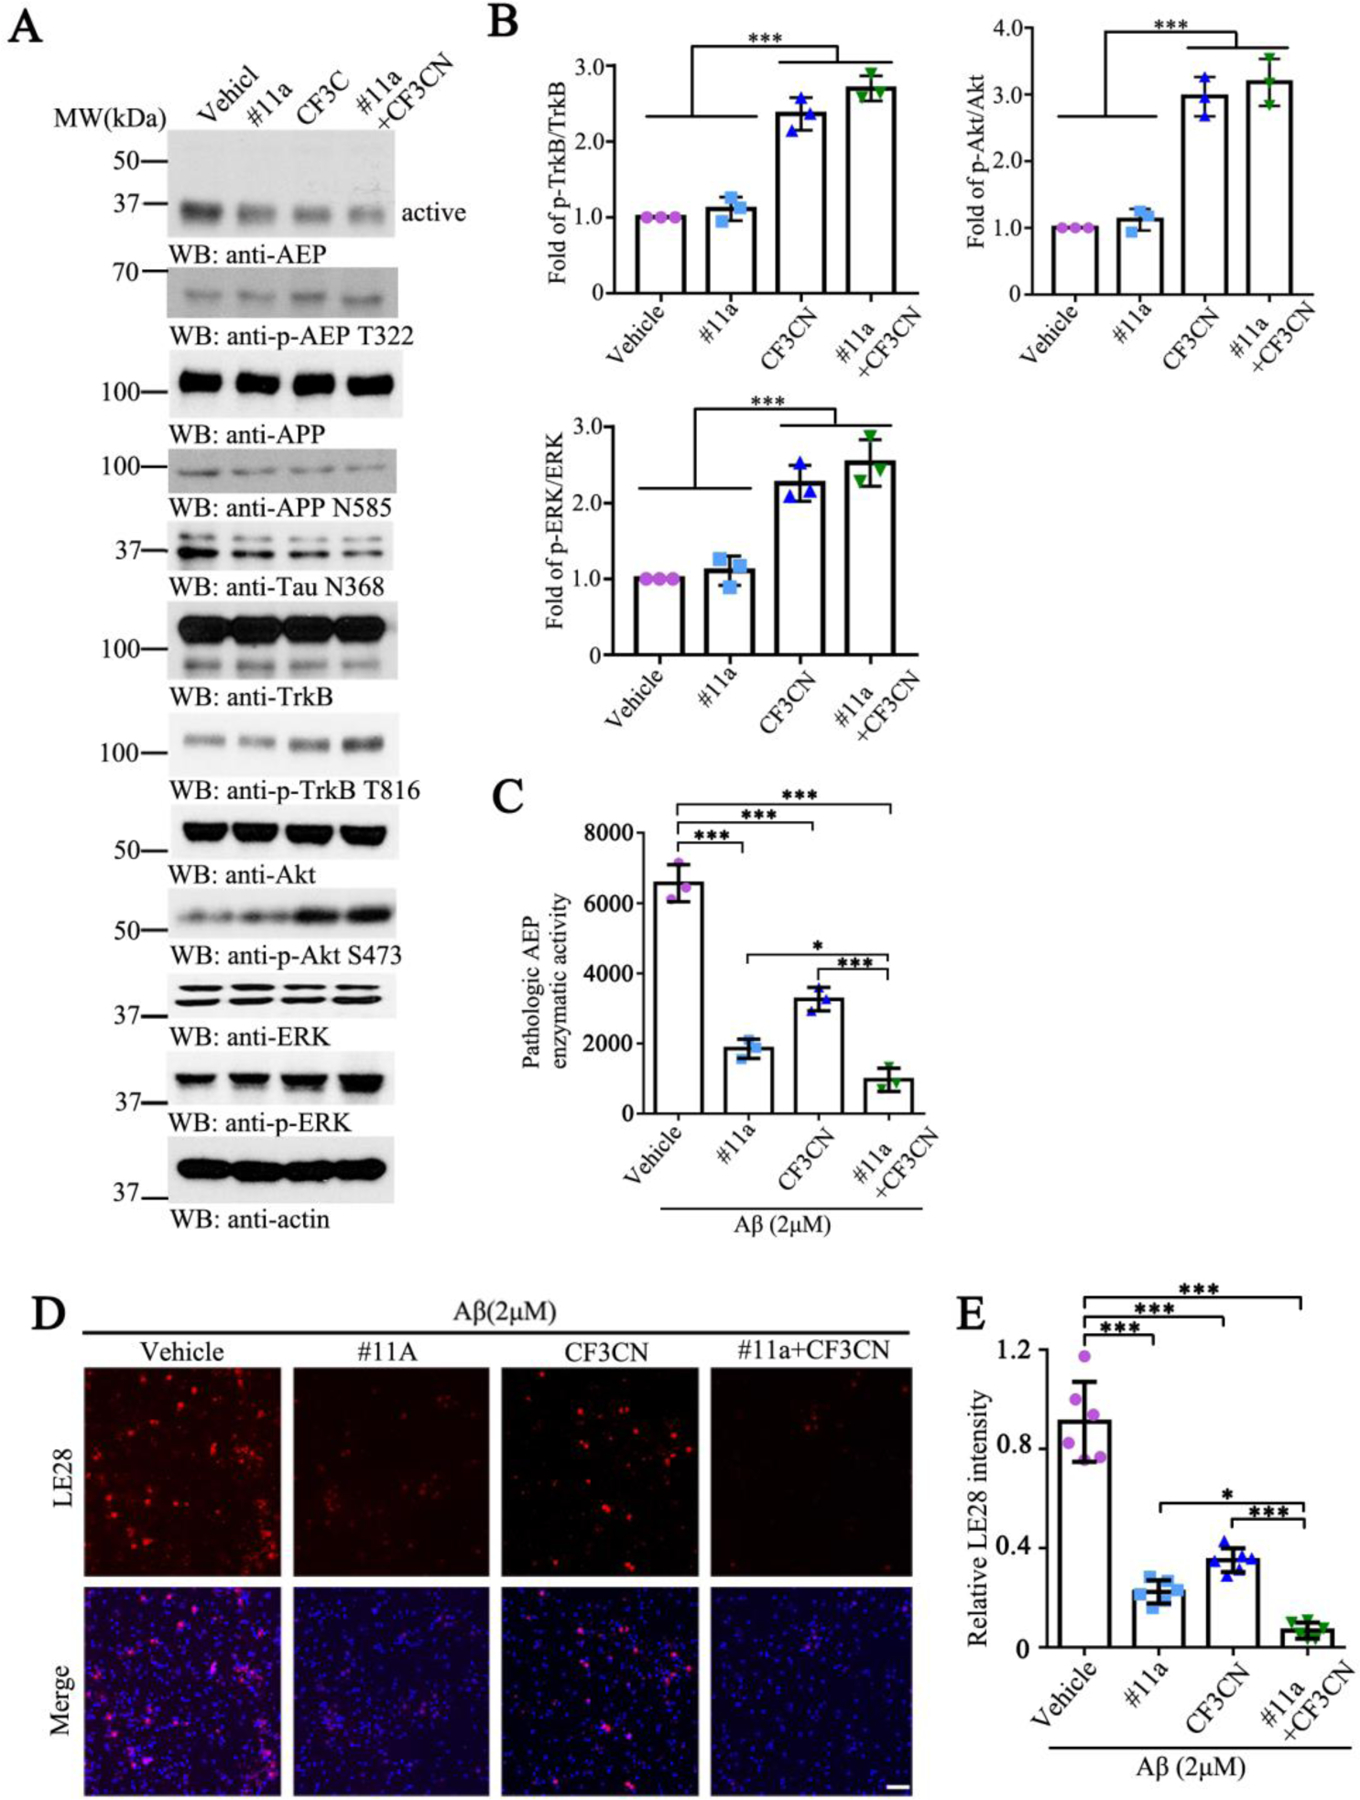
(A) Immunoblotting analysis of AEP, the p-TrkB and its downstream in vitro.
(B) Quantitative analysis of p-TrkB/TrkB, p-Akt/Akt and p-ERK/ERK in primary neurons. (n=3, one-way ANOVA)
(C) Enzymatic activity of AEP was determined using a fluorogenic substrate. (n=3, one-way ANOVA)
(D) Microscopy images of neurons exposed to Vehicle, #11a, CF3CN and their mixture, followed by incubation with LE28. Scale bar, 50 μm.
(E) Quantification of LE28 fluorescent intensity in primary neurons. (n=6, one-way ANOVA)
(Data represent the meauns ± SEM; *P < 0.05, **P < 0.01, ***P< 0.001).