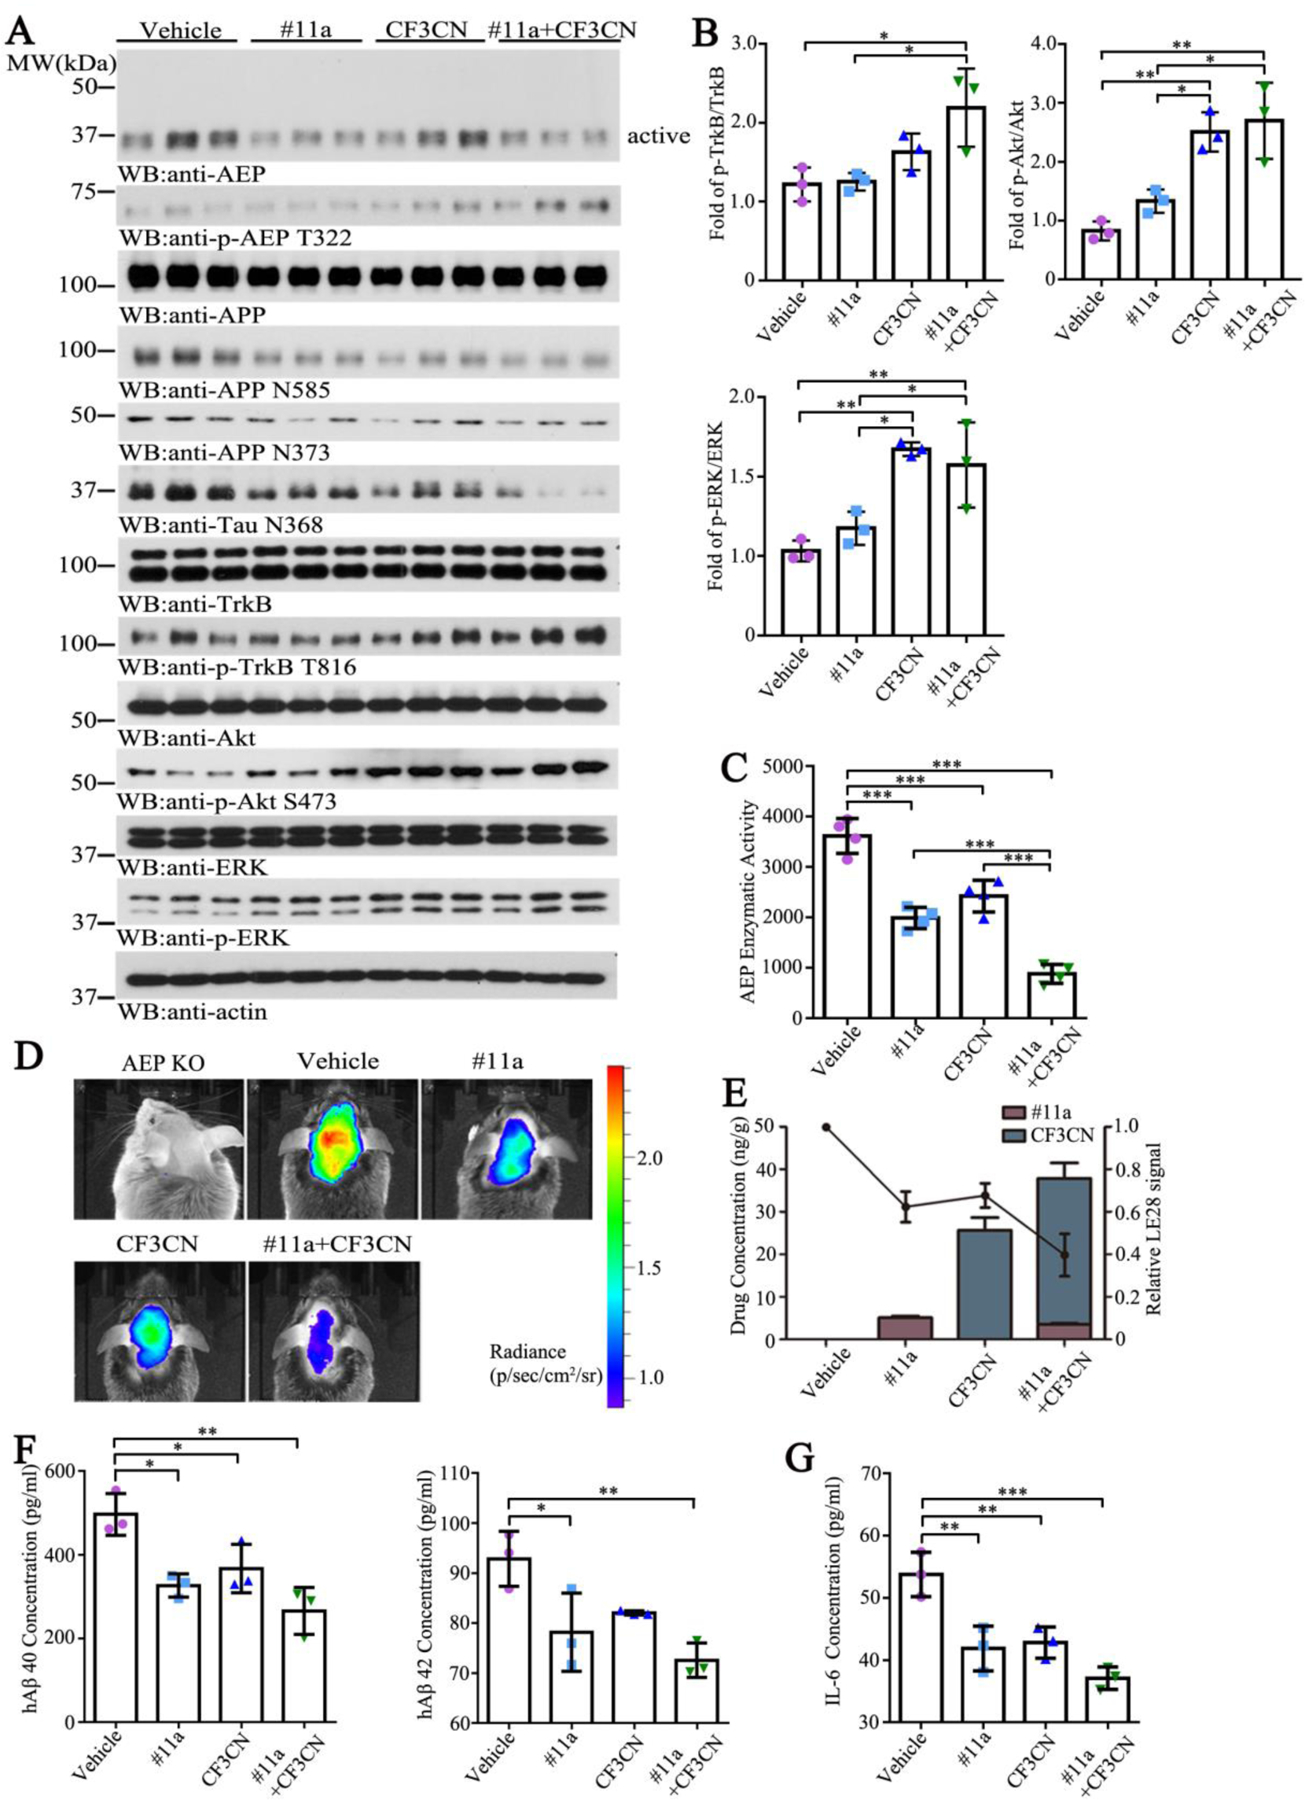
Figure 4. #11a, CF3CN and their mixture block AEP in the brain of 3xTg mice.

(A) Immunoblotting analysis of AEP, the p-TrkB and their downstream in vitro.
(B) Quantitative analysis of p-TrkB/TrkB, p-Akt/Akt and p-ERK/ERK in the brain in 3xTg mice. (n=3, one-way ANOVA)
(C) Enzymatic activity of AEP was determined using a fluorogenic substrate. (n=3, one-way ANOVA) (D) Imaging of 3xTg mice by using IVIS 100 after injection with LE28.
(E) Relationship between quantified LE28 signal intensity and drug concentrations in 3xTg mice brain. (n=3, one-way ANOVA)
(F) hAβ 40 and hAβ 42 levels were determined by ELISA. Both of hAβ 40 and hAβ 42 concentrations were reduced by #11a treatment. (n=3, one-way ANOVA)
(G) pro-inflammatory cytokines were determined by ELISA. The level of IL-6 was diminished by #11a and CF3CN treatments. (n=3, one-way ANOVA)
(Data are shown as mean ± SEM. *p<0.05, **p<0.01, ***p<0.001).
