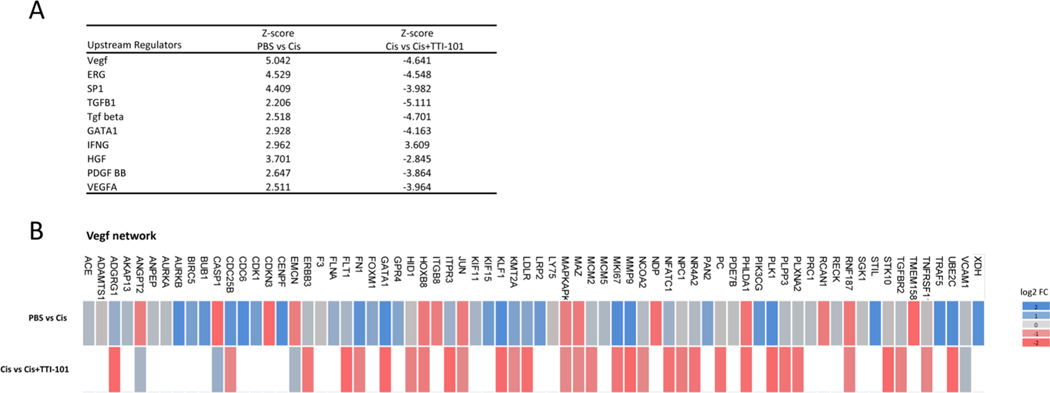
Fig. 9.
Results of IPA comparison analyses. A. Top upstream regulators driving TTI-101-dependent changes in DRG identified using the IPA comparison analysis tool. IPA core analysis was performed between PBS vs. Cisplatin and Cisplatin vs. Cisplatin + TTI-101, followed by comparison of the two core analyses. B. Heat map showing details of target genes in VEGF network. Fold change data for target genes upregulated (blue) or downregulated (red) is shown.

