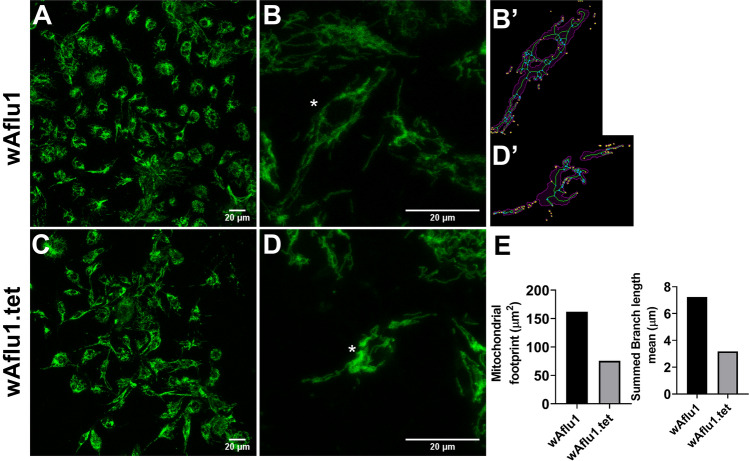
Figure 6.
Mitochondrial staining on Aedes fluviatilis cell lines. Mitochondrial staining on Aedes fluviatilis cell lines wAflu1 (Wolb+) and wAflu1.tet (Wolb−) was detected using MitoTracker specific staining (A, C), respectively. Mitochondria change distribution in presence of Wolbachia showing more diffuse marking in wAflu1 (B) than wAflu1.tet (D) cell culture. The (B′, D′) represent the analysis of the cell indicated by an asterisk in (B, D) and magenta region is the binarized signal used for calculating the area (E). The green lines are the morphological skeleton and yellow dots represent the end points of the skeleton and the blue dots represent the junctions. Mitochondrial mass was higher in wAflu1 cells than in wAflu1.tet inferred by mitochondrial footprint and summed branch length mean (E). Scale Bar: 20 µm.

