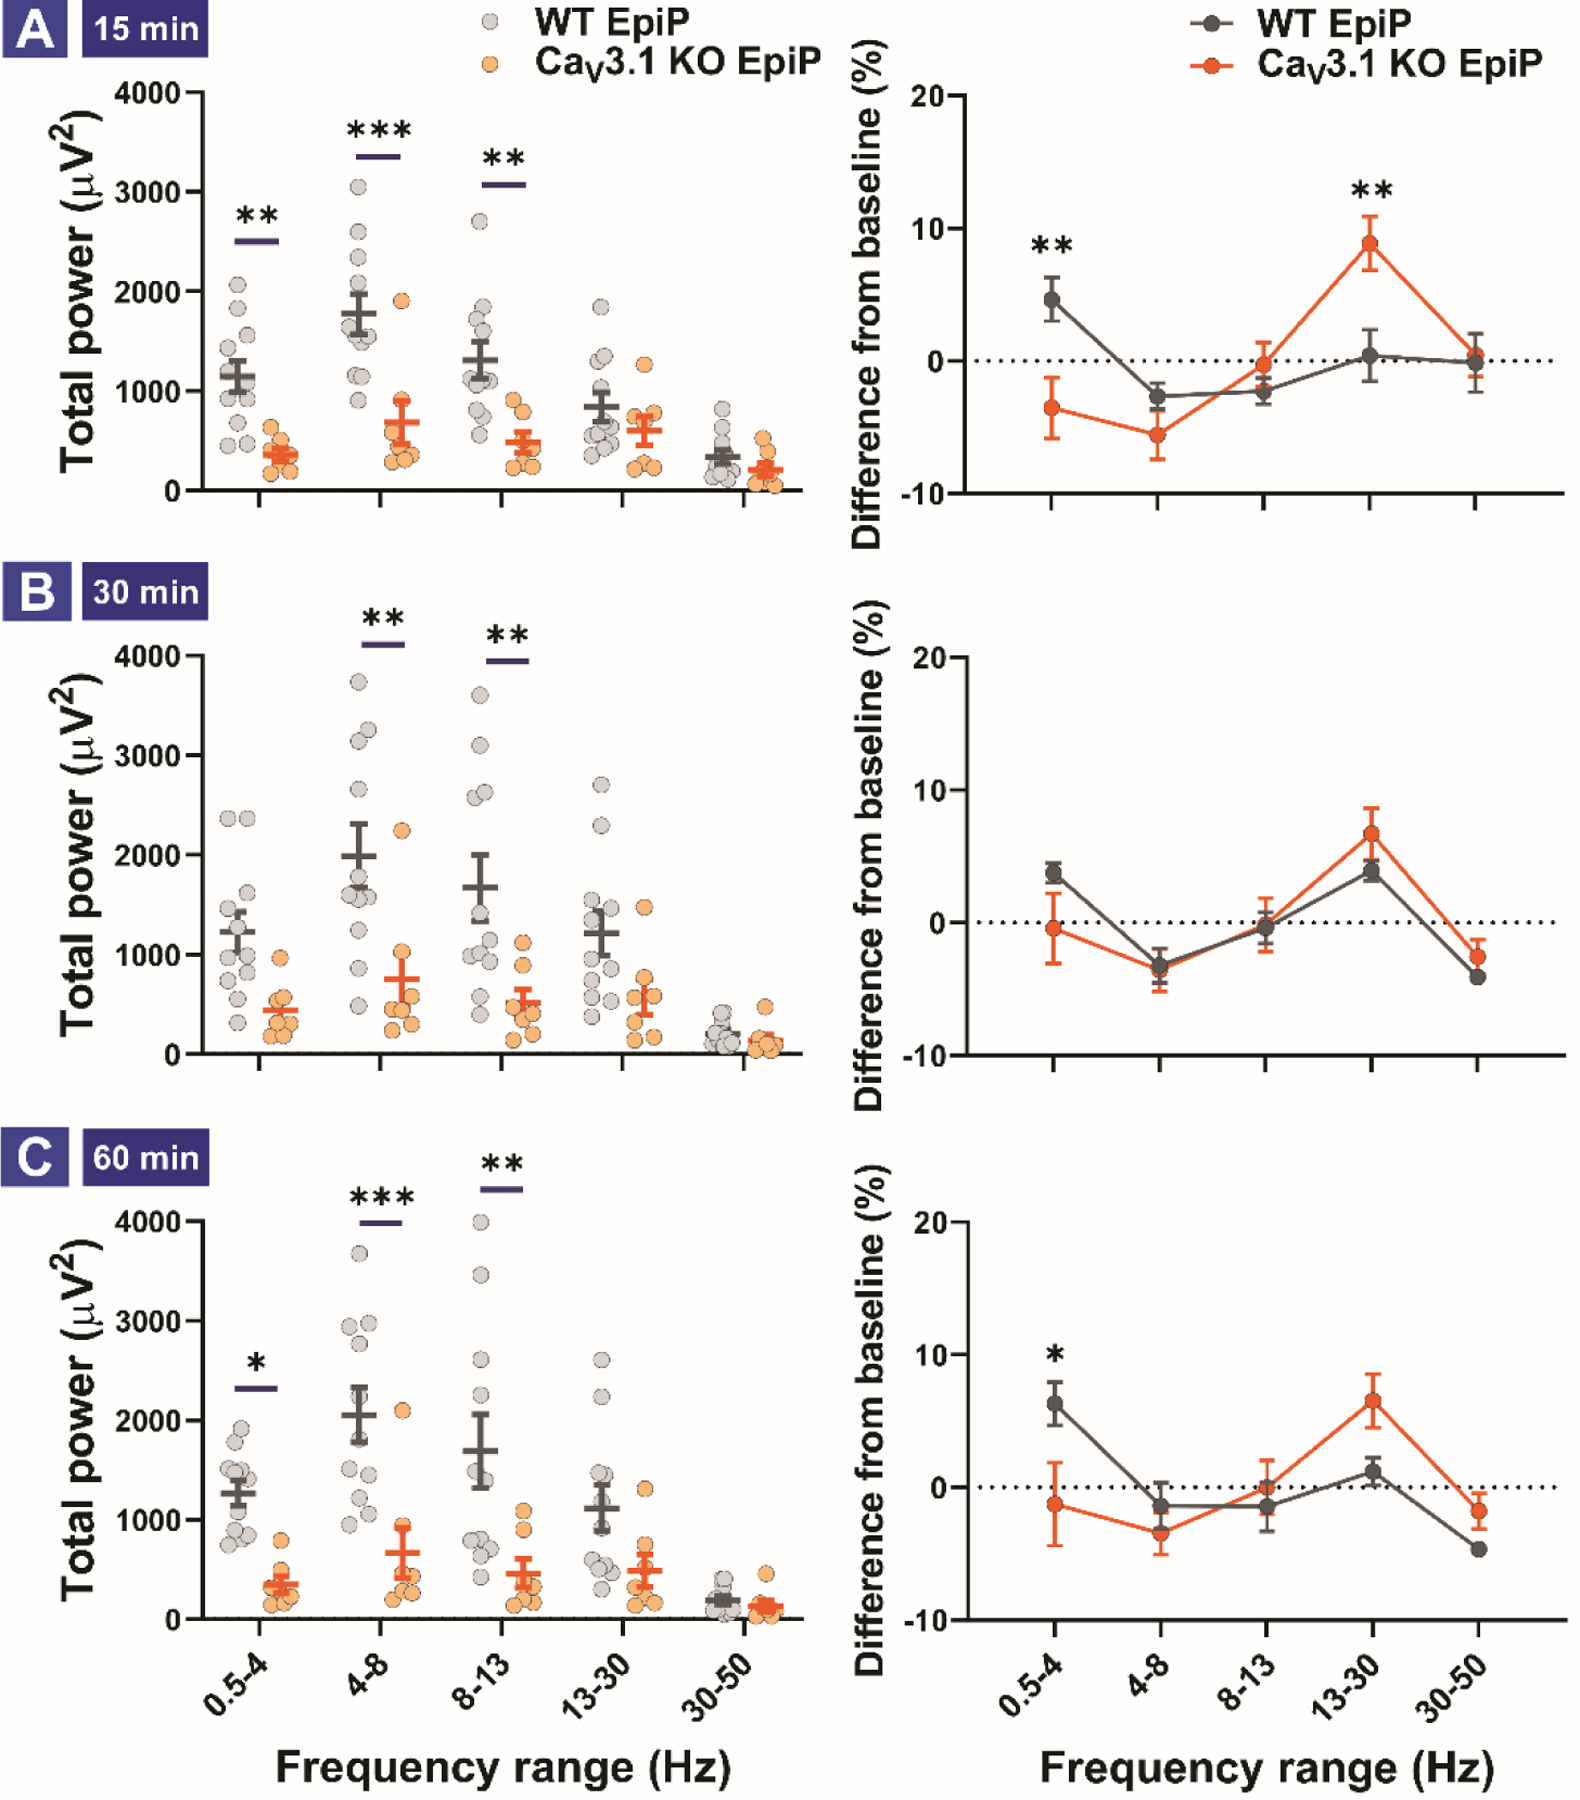
Figure 9. Total and relative EEG power differences between WT and CaV3.1 KO animals 15, 30 and 60 min after neurosteroid injections.

A. Total (left) and relative (right) power 15 min after i.p. injection of the neurosteroid. Analysis of total power revealed an increase in the δ, θ and α frequency ranges in WT animals in comparison to mutant mice (two way RM ANOVA, Interaction F(4,64) = 6.78, p < 0.001; Frequency F(4,64) = 19.09, p < 0.001, Genotype F(1,16) = 11.96, p = 0.003; post-hoc presented on Figure). Analysis of difference from baseline (relative power) revealed δ rise in WT and β rise in mutant animals (two way RM ANOVA, Interaction F(4,64) = 4.652, p = 0.002; Frequency F(4,64) = 4.976, p = 0.001, Genotype F(1,16) = 1.025, p = 0.326; post-hoc presented on Figure). B. Total (left) and relative (right) power 30 min after i.p. injection of the neurosteroid. Analysis of total power revealed an increase in the θ and α frequency ranges (two way RM ANOVA, Interaction F(4,64) = 6.86, p < 0.001; Frequency F(4,64) = 24.76, p < 0.001, Genotype F(1,16) = 6.807, p = 0.019; post-hoc presented on Figure). Analysis of differences from baseline (relative power) revealed no change between baseline and EpiP. C. Total (left) and relative (right) power 60 min after i.p. injection of the neurosteroid. Analysis of total power revealed an increase in the δ, θ and α frequency ranges in WT animals (two way RM ANOVA, Interaction F(4,64) = 7.781, p < 0.001; Frequency F(4,64) = 22.04, p < 0.001, Genotype F(1,16) = 9.197, p = 0.008; post-hoc presented on Figure). Analysis of difference from baseline (relative power) revealed rise in δ on WT animals (two way RM ANOVA, Interaction F(4,64) = 3.30, p = 0.016; Frequency F(4,64) = 5.020, p = 0.001, Genotype F(1,16) = 0.108, p = 0.747; post-hoc presented on Figure). Analysis of recordings was averaged from 11 (WT) and 7 (CaV3.1 KO) animals. *p < 0.05, **p < 0.01, ***p < 0.001
