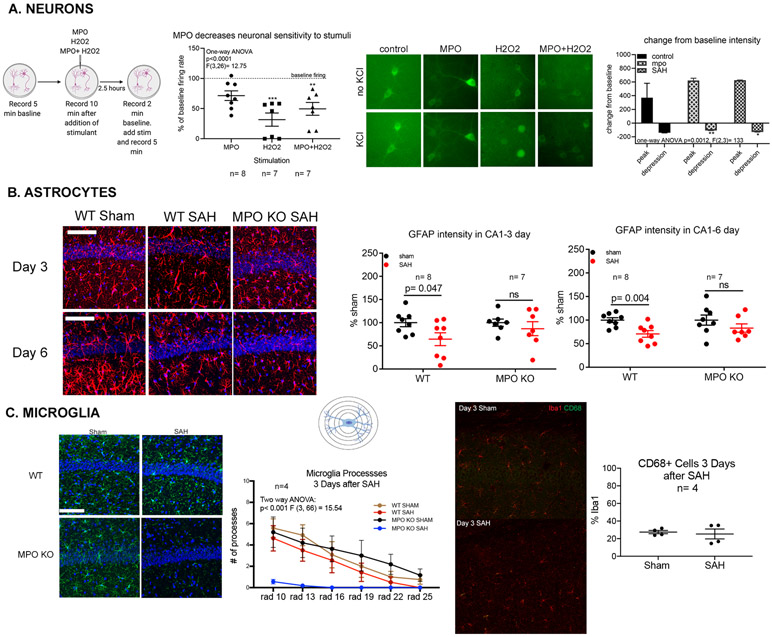
Figure 3: The enzymatic activity of MPO modulates brain parenchymal cell activity.
(A) Primary neuronal cultures obtained from Thy1-GCaMP3 mice. MPO alone had no effect on neuronal activity, while H2O2 decreases activity by more than 75%, and MPO + H2O2 decreased activity by 50% (left). The addition of MPO or MPO and H2O2 led to minimal to no neuronal death in cultures while the addition of H2O2 alone led to significant cell death (center). In vivo, 2-photon microscopy showed that SAH and the addition of MPO significantly affected the depth of signal depression observed in cortical neurons (right). (B) Representative confocal micrographs of astrocytes detected by GFAP (red) and Vimentin (green) in the CA1 subregion of the hippocampus 3 and 6 days (right) after SAH show that GFAP intensity is significantly decreased (p=0.047) in the CA1 region of the WT mouse but not in MPOKO mouse (center). 6 days after surgery, both GFAP intensity was significantly decreased (p=0.004) (right). No changes were observed in the MPOKO mouse at either time point (scale bar= 50μm). (C) Representative images of the morphology and density of Iba1+ myeloid cells in the CA1 region of the hippocampus (green) in sham and SAH mice 3 days post-surgery in WT and MPOKO mice (scale bar = 50 μm) (left). Scholl analysis shows Iba1+ cells have fewer processes (more activated) in MPOKO SAH mice (n=4) compared to WT and Sham MPOKO (p<0.001) (center). Representative images depicting the co-expression of CD68 and Iba1+ in the hippocampus after SAH. There was no significant change in the percentage of Iba1+ cells co-expressing CD68 in the hippocampus after SAH (right). Representations of experiments created with BioRender.

