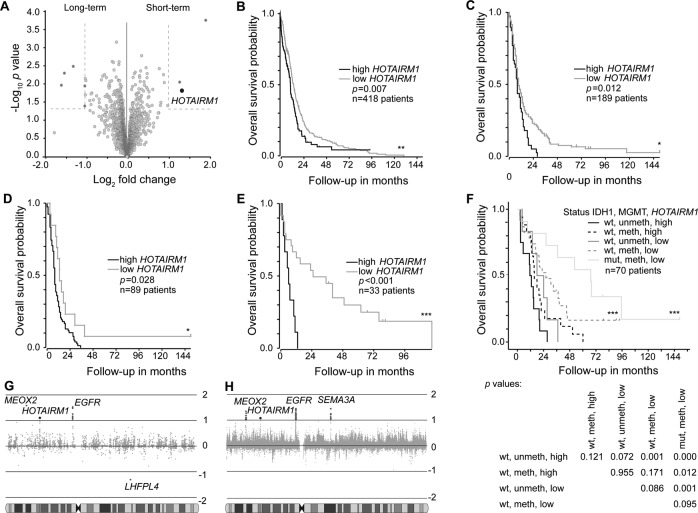
Fig. 1. Prognostic role of HOTAIRM1 expression in glioblastoma patient datasets.
A Volcano plot showing differential expression of lncRNAs in glioblastomas from patients with long-term (overall survival > 36 months) versus short-term (overall survival < 12 months) survival in the German Glioma Network (GGN) cohort24. The black circle highlights HOTAIRM1 while dark gray circles represent other lncRNAs with differential expression between survival groups (±2-fold change and p < 0.05). Light gray circles indicate lncRNAs that are not significant. B Overall survival plots of glioblastoma patients from TCGA [34] (https://www.cancer.gov/tcga) and C Gravendeel et al. [35] stratified according to high or low HOTAIRM1 expression levels. Cut-off for high HOTAIRM1 was determined by upper quartile and log rank statistics were calculated. D, E Overall survival of glioblastoma patients in the Gravendeel et al. [35] cohort according to HOTAIRM1 expression in IDH1-wildtype (D) and IDH1-mutant glioblastomas (E). F Overall survival of glioblastoma patients in the GGN cohort [33] stratified according to HOTAIRM1 expression, MGMT promoter methylation status, and IDH1 mutation status (wt: wild-type; mut: mutant; meth: methylated; unmeth: unmethylated). The table below the Kaplan-Meier graph lists p-values for the individual subgroups. G, H Expression of genes mapping to chromosome 7 in glioblastomas stratified according to presence or absence of chromosome 7 gain. G Data based on primary glioblastoma [37–39] Affymetrix U133 Plus 2 arrays or (H) TCGA [34] Human Exon 1.0 ST array show HOTAIRM1 as the only lncRNA with significantly increased expression in glioblastomas with chromosome 7 gain in addition to the coding genes EGFR, MEOX2 and SEMA3A. Log rank analysis for Kaplan–Meier survival plots; ***p < 0.001, **p < 0.01, *p < 0.05.

