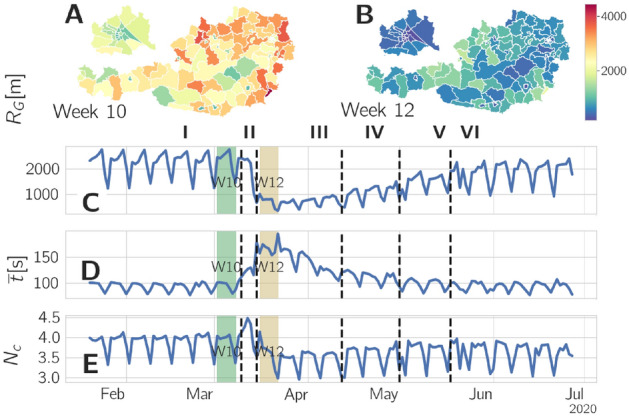
Figure 1.

Population-wide response to the COVID-19 crisis. The maps show the mobility (radius of gyration, ) for calendar week (A) 10 and (B) 12 for Austria. The timeseries below outline the changes in (C) , (D) the call duration per call , and (E) the number of calls per device . During the lock-down mobility was drastically reduced throughout Austria. The call duration per call increased dramatically and the number of calls, after a brief increase around the beginning of the lock-down, dropped below the pre-lock-down level.
