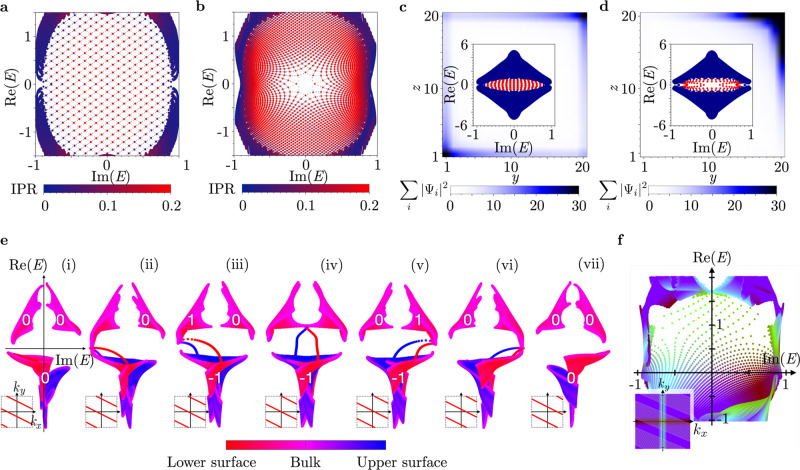
Fig. 2. Open boundary condition (OBC) spectra of the exceptional topological insulator.
a, b Complex-energy spectrum for the central point gap [cf. Fig. 1f] for OBC in the z direction and for a momentum resolution of δk = 2π/800 in both kx,y-directions (B = 0.2, δ = 1). Red tones highlight states of large surface localization, with the light gray mesh of finer resolution δk = 2π/2400 indicating the band energies along lines parallel to either the kx or ky axis. Concretely, we compute the inverse participation ratio (IPR), which sums the wavefunction over the lattice sites along the finite dimension z. A completely delocalized (bulk) state corresponds to vanishing IPR. A single surface band covers the point gap with a regular grid for α = π/2 (a), whereas the presence of an exceptional point at the origin for α = 0 is revealed by a 2π disclination (b) (see also Supplementary Note 3). c, d Summed density profile ∑i∣ψi∣2 of the eigenstates in the central point gap for open boundaries in z and y direction indicated with color scale (B = 0.2, δ = 1), showing a surface skin effect. The insets display the corresponding energy spectrum in the complex plane, with the selected states highlighted in red. The single surface band for α = π/2 shows a boundary localization in two opposite corners (c), whereas the exceptional point for α = 0 localizes all surface states in one corner (d). e Chern number (white numbers) evolution for a series of cuts in the surface BZ to illustrate the chiral charge pumping around the point gap for α = 0.9 (B = 0.5, δ = 1). The employed colormap highlights the localization of the respective eigenstates. f Combination of cuts from panel e, zoomed onto the central point gap, highlighting how the single-sheet covering in panels a, b relates to the chiral edge states in e. The inset indicates the employed color scheme for momenta in the surface BZ as well as the cuts used for diagonalization (shaded area). Only bulk states and states localized on the upper surface are displayed (α = 0.9, B = 0.5, δ = 1).

