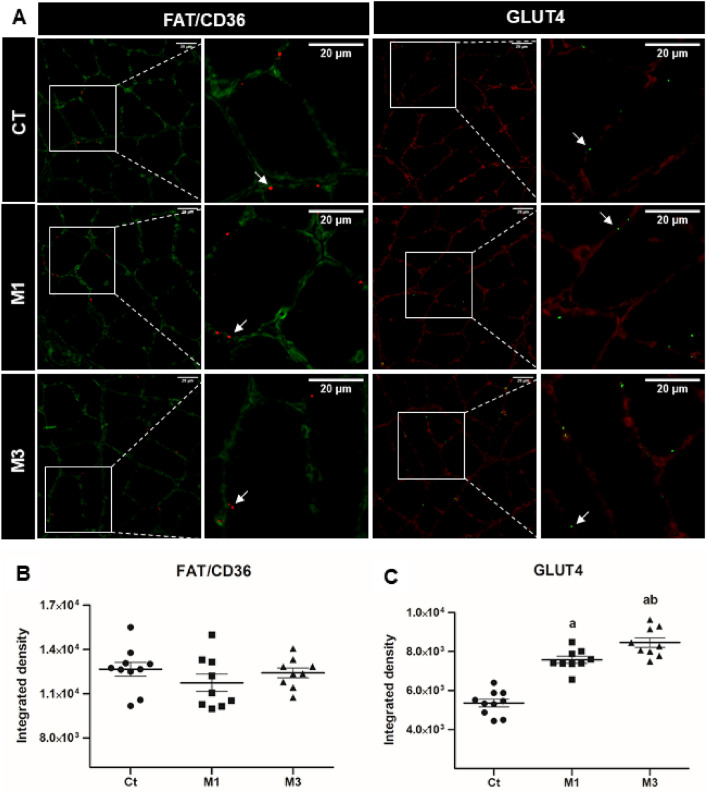
Figure 2.
GLUT4 and FAT/CD36 in skeletal muscles. Representative samples of laminin (green) with FAT/CD36 (red) in the soleus skeletal muscle with immunofluorescence (A). Representative samples of laminin (red) with GLUT4 (green) in the soleus skeletal muscle with immunofluorescence (A) in the control group (Ct) and rats treated with melatonin and euthanized 1 h (M1) or 3 h after the last procedures group (M3). The white arrows indicate FAT/CD36 and GLUT4 in the soleus skeletal muscle. The figures represent the means and standard errors of the FAT/CD36 (B) and of the GLUT4 (C). ap < 0.05 with respect to Ct; bp < 0.05 with respect to M1 for the same parameter. For the illustration, an objective lens = 20 × was used; bars = 20 µm; zoom = 300 height and 300 width.

