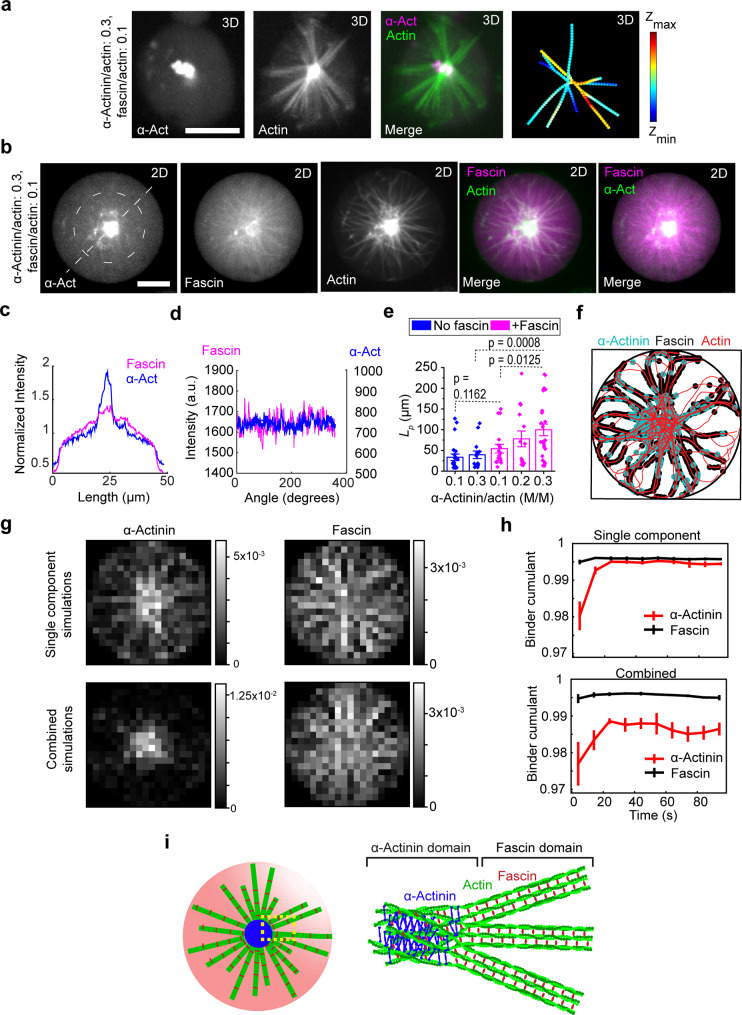
Fig. 4. α-Actinin and fascin sort in central aster structures.
a Representative 3D-reconstructed confocal fluorescence images of α-actinin, actin, merged, and skeletonized construct of an encapsulated central aster, respectively, from left to right. α-Actinin, 1.5 μM (including 14 mol% TMR α-actinin). Fascin, 0.5 μM (including 50 mol% AF647 Fascin). Actin, 5 μM. Scale bar, 10 μm. b Representative 2D confocal fluorescence images of α-actinin, fascin, actin, and merged images of an encapsulated central aster in a large GUV. α-Actinin, 1.5 μM (including 13 mol% TMR α-actinin). Fascin, 0.5 μM (including 16 mol% TMR α-actinin). Actin, 5 μM. Scale bar, 10 μm. c, d Fluorescence intensity of α-actinin and fascin along the dashed line drawn across the GUV (c) and circle drawn around central aster outside the actin cluster (d) in (b). e Persistence length of actin bundles without and with fascin (fascin/actin, 0.1 [M/M]) at different α-actinin/actin ratios indicated. Lp [fascin:α-actinin:actin] = 33.3 ± 10 μm [0:1:10], 39.3 ± 9 μm [0:3:10], 54.2 ± 11.4 μm [1:1:10], 77.8 ± 19 μm [1:2:10], and 99.7 ± 15 μm [1:3:10]. Nbundles = [22 14 17 14 26] in order of x-axis categories, 3 GUVs per category. f Representative structure after 100 s of simulation of actin filaments (red) cross-linked by α-actinin (cyan) and fascin (black). The border of the containing circle is shown in black. g PDFs of α-actinin (left) and fascin (right) from either simulation of each alone with actin (top row) or the two in combination with actin (bottom row). PDFs are constructed from the last frames of five independent simulations of 100 s for each condition. h Binder cumulant as a function of time for each cross-linker separately with actin (top) and the combined simulation (bottom). Values are measured for each simulation independently and then averaged. Error bars represent one standard deviation from the mean. i Schematic of cross-linker-size-dependent sorting in confined α-actinin–fascin cross-linked actin network.

