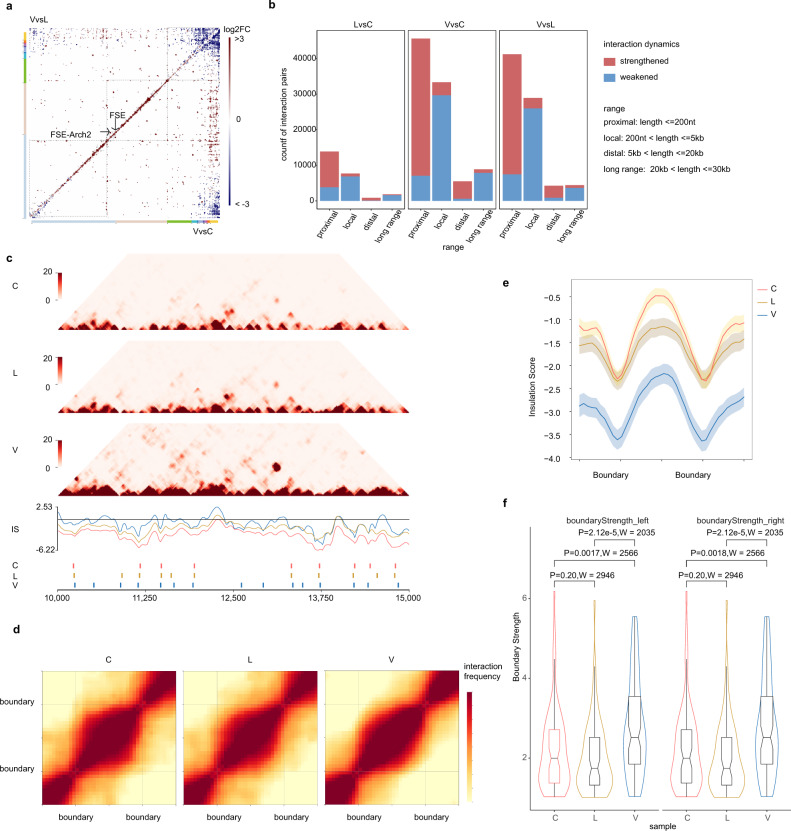
Fig. 4. Dynamic structures in different phase of viral cycle.
a Heatmaps showing comparisons of RNA–RNA interactions in virions vs. cells (VvsC) and virions vs. lysates (VvsL). VvsL is in the upper quadrant and VvsC is in the lower quadrant. b Differential interactions were classified according to spans as indicated. Bar plots shows number of strengthened or weakened interactions in each category. c RNA interaction maps (Top) binned at 10 nt resolution show interactions 10–15 kb on SARS-CoV-2 genome in C, L, and V samples. Line plots (median) show insulation profiles. Short lines (bottom) reflect boundaries. d Maintenance of domains during SARS-CoV-2 virus life cycle. Heatmaps showing the normalized average interaction frequencies for all boundaries as well as their nearby regions (±0.5 domain length) in C, L, and V samples. The heatmaps were binned at 10 nt resolution. e The average normalized insulation scores were plotted around boundaries from 1/2 domain upstream to 1/2 domain downstream and divided into 40 bins. Shadowed area show SE bands at each bin. n = 76, 71, and 96 domains in C, L, and V samples. f Violin plot compare boundary strength among C, L, and V samples. Showing higher boundary strength in V samples. Boxplots show largest (upper whisker), smallest (lower whisker), 50% quantile (center), upper hinge (75% quantile), and lower hinge (25% quantile). Comparisions were made by two-sided two-sample Wilcoxon’s rank-sum test, no multiple comparisons adjustment was made. P-value and Wilcoxon’s rank-sum test statistics W were indicated. n = 76, 71, and 96 domains in C, L, and V samples.

