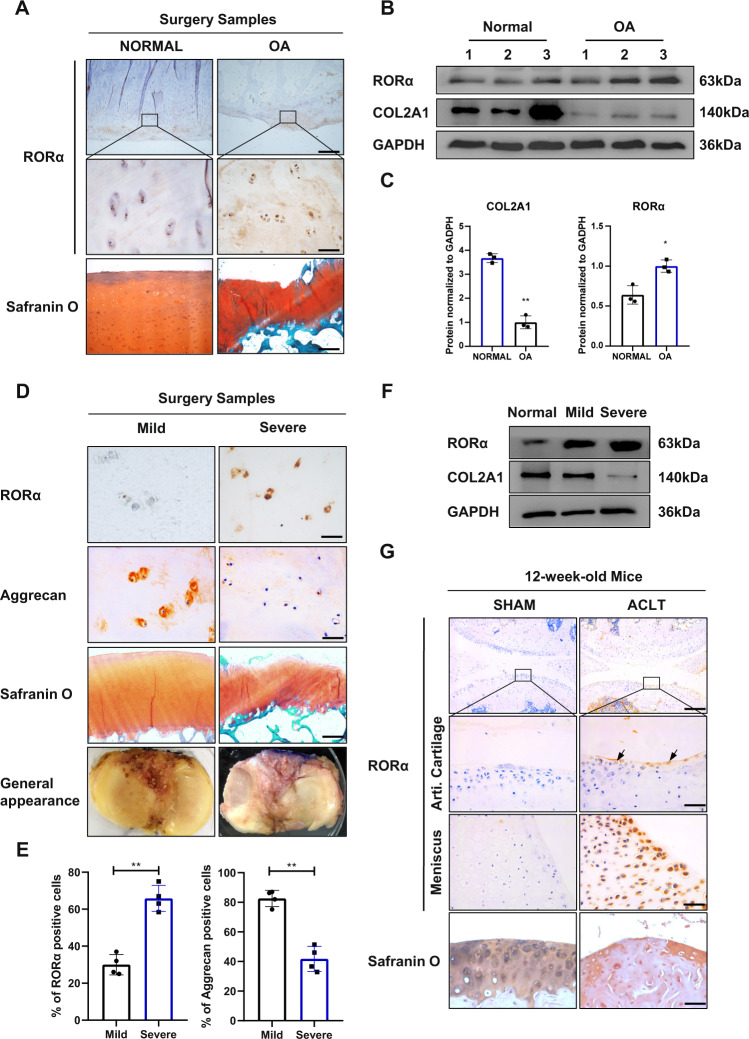
Fig. 1. The expression level of RORα is positively correlated with the severity of OA and cartilage damage in human OA samples and surgery-induced OA mice model.
A IHC and safranin O staining for detection of RORα in OA samples and controls. Boxed areas indicate the typical area of RORα expression. Scale bars, 500 and 50 μm for ×40 and ×400 images, respectively. B Representative western blot images for detection of RORα and COL2A1 in the cartilage tissue from control and OA patients (n = 3). C The quantification of western blot for detection of RORα and COL2A1 from OA patients and normal control. D Representative images of IHC staining for RORα and aggrecan, Safranin O staining, and the general appearance of different severity of OA samples. Scale bars, 50 μm for IHC staining and 500 μm for Safranin O staining images. E The percentage of RORα-positive cells and aggrecan-positive cells in mild or severe degenerated cartilage samples from OA patients (n = 4). F Western blot for detection of RORα and COL2A1 from the cartilage tissue of different severity of OA. G IHC and safranin O staining for RORα in mouse knee joints articular cartilage and meniscus 8 weeks after OA mouse model creation via ACLT surgery (n = 3). Scale bars, 200 and 50 μm for the upper and the middle images, respectively. The statistical data in C and E were analyzed with Student’s t test. *P < 0.05; **P < 0.01. All data shown above are presented as the mean ± SD.

