
Fig. 2.
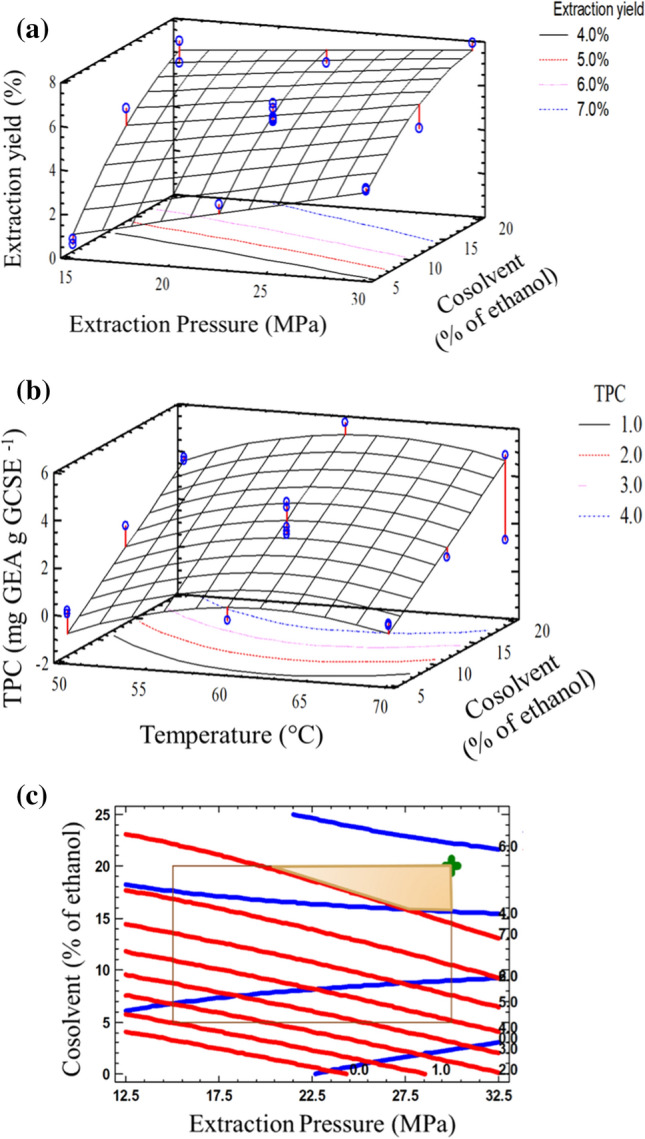
a Response surface plot of the extraction yield as a function of extraction pressure and cosolvent content at 60 °C, b Response surface plot of the total phenolic compound content as a function of the temperature and cosolvent content at 30 MPa, and c Overlaid contour plots of the extraction yield and total phenolic compound content at 60 °C. The shaded region is acceptable: total phenolic compound content > 4.0 and extraction yield > 7.0