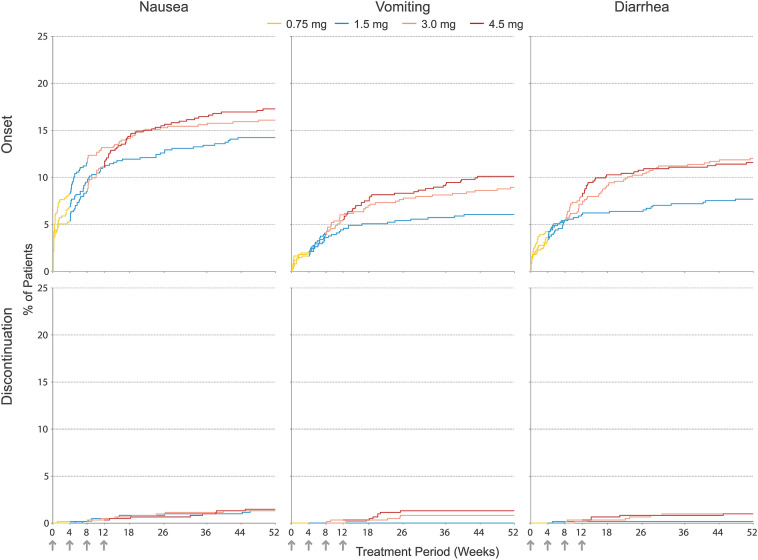
Fig. 4.
Kaplan–Meier curves for cumulative incidence of the onset of nausea, vomiting, or diarrhea adverse events (top) and discontinuation due to nausea, vomiting, or diarrhea adverse events (bottom) by treatment group through week 52. Arrows denote weeks at which dose escalation steps occurred. Line color denotes the actual dose administered at a specific point in time. All patients began treatment with a once-weekly dose of 0.75 mg (yellow) for a period of 4 weeks and then escalated to the target dose of 1.5, 3.0, or 4.5 mg at 4-week intervals

