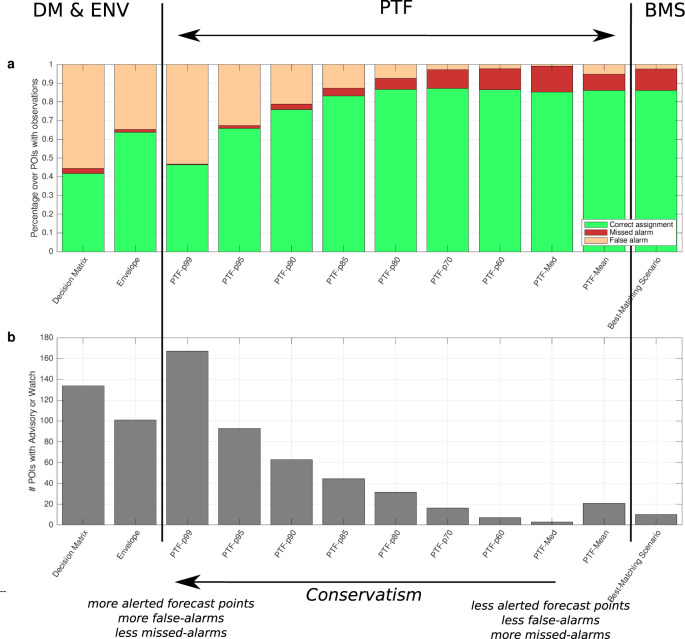
Fig. 6. Alert levels from PTF and non-probabilistic methods.
We compare the assigned and observed alert levels based on DM, ENV, BMS, and PTF statistics for the 13 events in the testing dataset considered in this paper (Fig. 5a). a Average percentage of correct- (green), false- (yellow) and missed alarms (red) at forecast points with observations. b Average total number of forecast points with advisory and watch levels at all forecast points. Note that CAT-INGV DM is less conservative than the original NEAMTWS DM. The different PTF statistics allow covering the full range of conservative choices, encompassing the range defined by existing non-probabilistic methods. The selection of a specific PTF percentile can be explicitly linked to a pre-defined level of conservatism, quantifying the expected rate of false/missed alarms.

