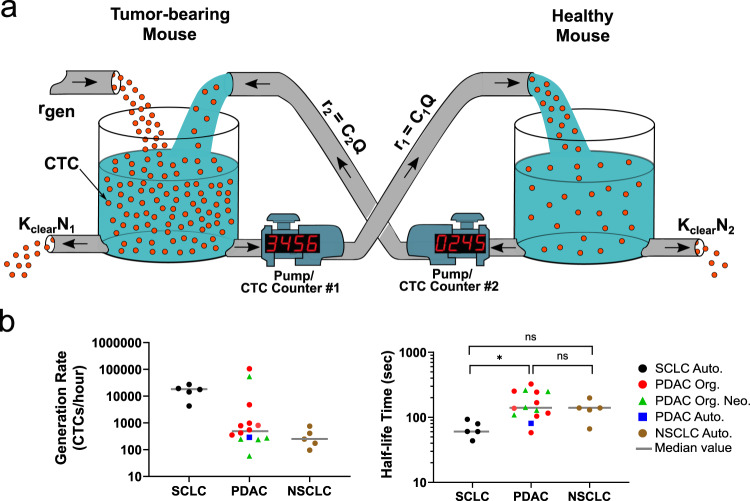
Fig. 2. An analytical model for extracting CTC generation rate and half-life time in blood.
a A visual representation of the relevant parameters of the blood exchange technique to solve for the generation rate and the half-life time of CTCs. The circulatory system of each mouse is represented as a well-mixed container of red spheres (CTCs). In the TBM (left tank) CTCs enter the circulation from the tumor microenvironment at a rate equal to rgen. CTC clearance out of the circulation is represented by a hole at the bottom of each container with a clearance rate of Kclear × N. Pumps with counters represent the CTC counter systems and their peristaltic pumps that transfer the CTC-containing blood at rates equal to C × Q. r: rate of CTC transfer. C: concentration. Q: flow rate. Kclear: first-order clearance coefficient. N: total number of CTCs in each mouse. b Scatter plots for the calculated CTC generation rates and the half-life times of each of the different small-cell lung cancer (SCLC), pancreatic ductal adenocarcinoma (PDAC), and non-small-cell lung cancer (NSCLC) blood-exchange experiments (*p < 0.05 (p = 0.0136), Kruskal−Wallis nonparametric test with Dunn’s sample pairs analysis). For SCLC, n = 5 biologically independent experiments. For PDAC, n = 8, 5, and 1 biologically independent experiments, respectively, for Org, Org. Neo., and Auto. For NSCLC, n = 5 biologically independent experiments. Auto autochthonous. Org. organoid. Neo neoantigen. ns not significant.

