FIGURE 6.
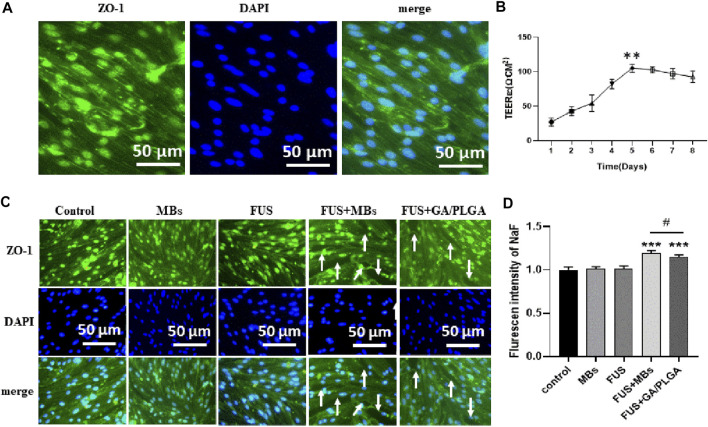
(A) The in vitro BBB model. Blue indicates the nucleus and green indicates the ZO-1 tight junction protein. (B) Resistance change of the in vitro BBB model. The resistance value of the BBB model was 105.12 ± 4.92 Ω.CM2 on the fifth day (**p < 0.01 versus the other group). (C) L (Alexa Fluor488) fluorescent secondary antibody labeled the ZO-1 tight junction protein. DAPI labeled the nucleus. FUS combined with lipid MBs or GA/PLGA MBs could open the BBB model, and the white arrow indicates that the tight junction part was already open. (D) Florescent intensity of NaF in the FUS + MBs group was 1.19 ± 0.02 (***p < 0.001 versus the control group). Florescent intensity of NaF in the FUS + GA/PLGA group was 1.19 ± 0.02 (***p < 0.001 versus the control group and # p < 0.05 versus the FUS + MBs group).

