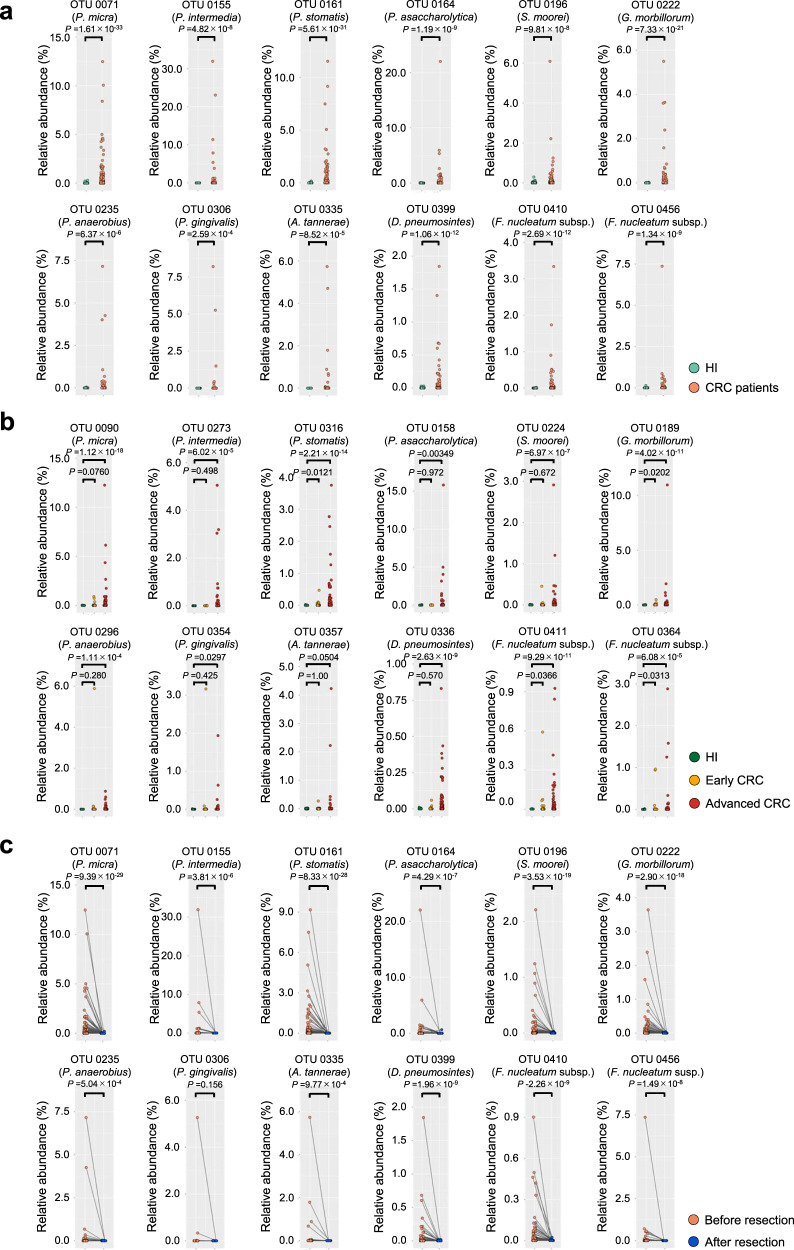
Fig. 1. Gut bacteria enriched in CRC patients.
a Scatter plots showing the abundance (%) of indicated bacterial OTUs enriched in colorectal cancer (CRC) patients of Cohort-1 as determined by 16S rRNA gene-sequencing analysis. The green and red dots represent healthy individuals (HI) or CRC patients, respectively. The name of bacterial species most likely to correspond to each OTU is shown. Statistical significance was determined with a two-tailed Wilcoxon rank-sum test. b Scatter plots showing the abundance (%) of indicated bacterial OTUs enriched in CRC patients of Cohort-2 as determined by 16S rRNA gene-sequencing analysis. Green, yellow and red dots represent healthy individuals (HI) or early CRC patients, or advanced CRC patients, respectively. Statistical significance was determined with a Kruskal–Wallis rank-sum test followed by two-tailed pairwise Wilcoxon rank-sum tests. c Scatter plots showing the abundances (%) of the indicated OTUs in total gut bacteria of CRC patients of Cohort-1 before (red dots) and after (blue dots) surgical resection of primary tumours. Statistical significance was determined with a two-tailed Wilcoxon signed-rank test. P values < 0.05 were considered significant. Source data are provided as a Source Data file.

