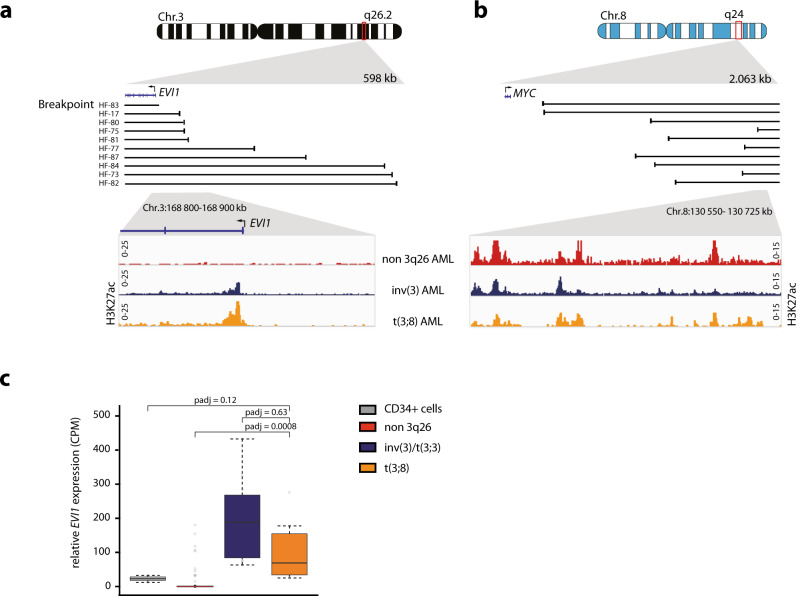
Fig. 1. MYC super-enhancer translocation and EVI1 overexpression in t(3;8)(q26;q24) AML.
a Upper part, schematic depiction of Chr.3, zoomed in on 3q26.2. Black lines correspond to sample-specific breakpoints detected by 3q-seq for each indicated t(3;8)(q26;q24) patient. Lower part: zoom-in on the EVI1 promoter, H3K27ac ChIP-seq data for a primary non-3q26 AML sample in red (N = 1, AML-185), an inv(3)(q21q26) in blue (N = 1, AML-2190) and a t(3;8)(q26;q24) in orange (N = 1, AML-17). b Similar to A, but here in the upper part a schematic depiction of Chr.8, zoomed in on 8q24. Lower part: H3K27ac ChIP-seq data as in a, but here is a zoom-in on the +1.7 Mb MYC super-enhancer. c EVI1 expression measured by RNA-seq in counts per million (CPM) for normal CD34 + HSPCs (N = 9, gray), non-3q26 AMLs (N = 114, red), inv(3)/t(3;3)(q21;q26) AMLs (N = 11, blue), and t(3;8)(q26;q24) AMLs (N = 10, orange). The lower and upper edges of the boxplots represent the first and third quartiles, respectively, the horizontal line inside the box indicates the median. The whiskers extend to the most extreme values within the range comprised between the median and 1.5 times the interquartile range. The circles represent outliers outside this range. The statistical significance of the comparisons between these groups was determined by the Wald test in the DESeq2 package. Adjusted p-values (padj) following multiple testing corrections by the Benjamini–Hochberg procedure are displayed.

