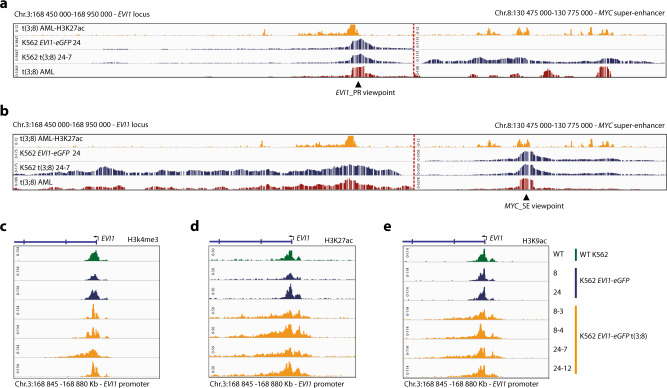
Fig. 3. EVI1 promoter hyperactivation upon interaction with MYC SE in t(3;8) AML.
a Chromatin interaction shown by 4C-seq data, using the EVI1 promoter as the viewpoint (triangle symbol). The upper panel shows H3K27ac ChIP-seq data of a t(3;8) primary AML (AML-17). Indicated by H3K27ac signal peaks, on the left is the EVI1 promoter and on the right is the −1.7 Mb MYC super-enhancer, separated by a dotted red line. In the first 4C track (blue), parental K562 EVI1-eGFP clone 24; in the second, K562 t(3;8) EVI1-eGFP clone 24-7 (also blue); and in the bottom track (red), data of a primary t(3;8) AML (AML-17). b Similar to a, but using the MYC super-enhancer as the viewpoint (triangle symbol). The long stretch (500 Kb) of chromosomal interaction shown for the K562 t(3;8) EVI1-eGFP clone 24-7 shows a high resemblance with the interaction seen for the primary t(3;8) AML (AML-17) (second blue and red tracks, respectively). c H3K4me3 ChIP-seq data for K562 EVI1-eGFP parental lines (blue), the t(3;8) clones 8-3, 8-4, 24-7, 24-12 (orange), and K562 WT (green). A peak located on the EVI1 transcriptional start site marks the promoter region. d H3K27ac ChIP-seq data, comparing EVI1 promoter activation of the four t(3;8) clones (orange) to the EVI1-eGFP parental lines (blue) or K562 WT (green). e H3K9ac ChIP-seq data, confirming the hyperactivation of the EVI1 promoter in the t(3;8) clones (orange), compared to the parental lines (blue) or K562 WT (green).

