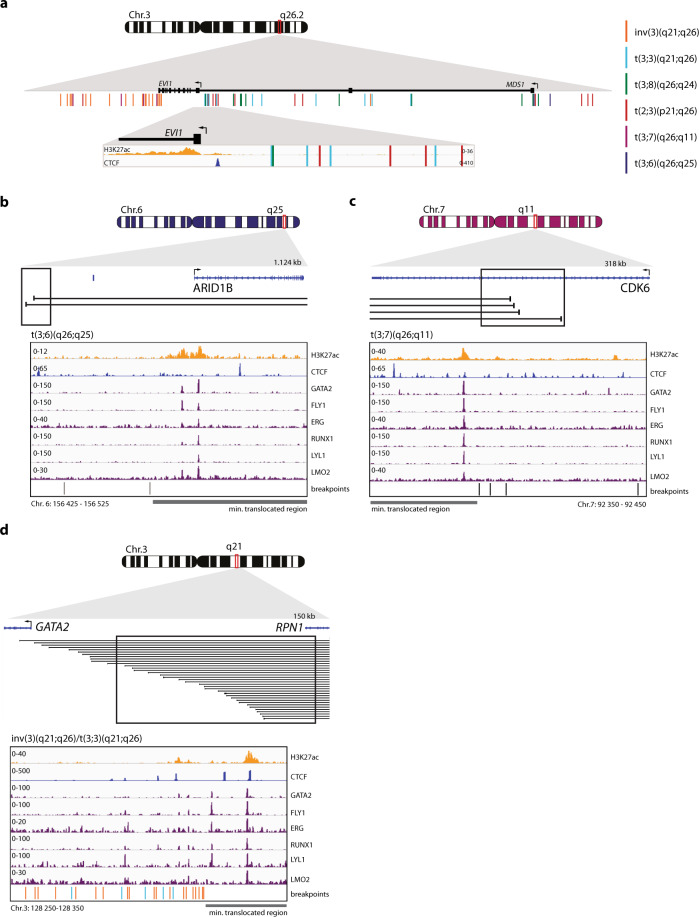
Fig. 7. CTCF enhancer-docking site upstream of the EVI1 promoter is preserved in 3q26-rearranged AML.
a Schematic depiction of Chr.3 with a zoom-in on the EVI1 locus, indicating the exact breakpoints (detected by 3q-seq) of 3q26-rearranged AMLs as vertical lines. In the lowest zoom-in panel the EVI1 promoter with a CTCF binding site upstream marked, respectively by H3K27ac (t(3;8) AML-17, orange) and CTCF (K562 t(3;8) clone 24-7, blue) ChIP-seq. b Schematic overview of Chr.6 and the locus where the breakpoints (black lines) were found by 3q-seq in t(3;6)(q26;q25) AML. The black box indicates the area of which the zoom-in is shown below. Zoom-in: putative enhancer indicated by H3K27ac (t(3;8) AML-17, orange), CTCF binding (K562 t(3;8) clone 24-7, blue) and HSPC active transcription factor recruitment (CD43+ cell29, purple) at translocation site. The lines below indicate the exact breakpoints. The gray bar the minimal translocated region brought into close proximity of EVI1 in that specific translocation. c Same as b, but here for t(3;7)(q26;q11) AMLs. d Same as b, but here for inv(3)/t(3;3)(q21;q26) AMLs. The exact translocated locus was previously shown to be an enhancer of GATA215.

