Figure 3.
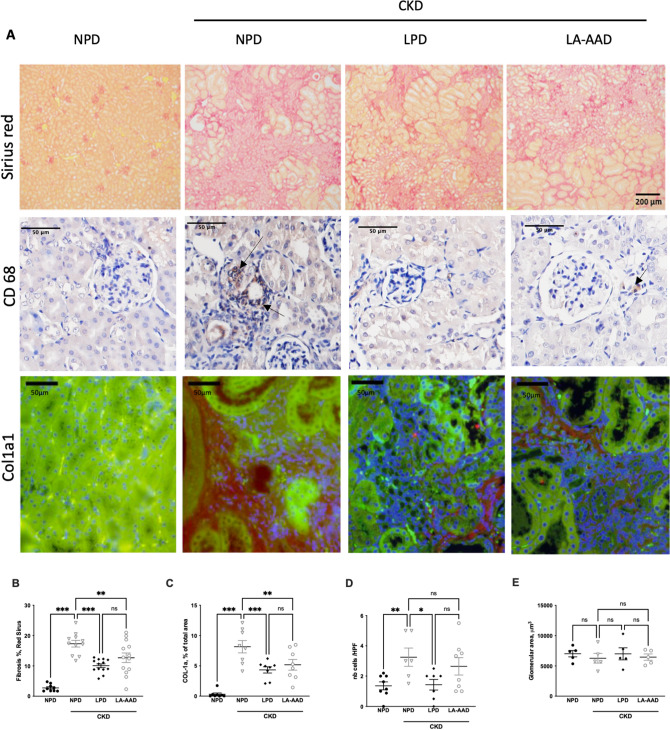
Evaluation of kidney fibrosis, glomerulosclerosis and kidney inflammation in control and CKD mice. (A) Representative images of kidney sections stained with Sirius Red viewed under bright field × 10. Scale bar represents 200 µm. Immunohistochemistry staining for CD68 and immunofluorescence staining for Col1a1. Scale bar represents 50 µm. (B) Sirius red morphometric and (C) Col1a1 evaluation in control and CKD mice treated with normoproteic diet (NPD), low protein diet (LPD) and low aromatic amino-acid diet (LA-AAD). (D) Tubular cell damage scores obtained by CD68 quantification (E) Glomerular area was quantified using ImageJ software and expressed as glomerular volume. CKD: chronic kidney disease. Data are expressed as mean ± SEM for n = 9–13 animals in each group. **p < 0.01, ***p < 0.001 versus CKD-NPD; (ANOVA and Dunnett post hoc test). nb Numbers.

