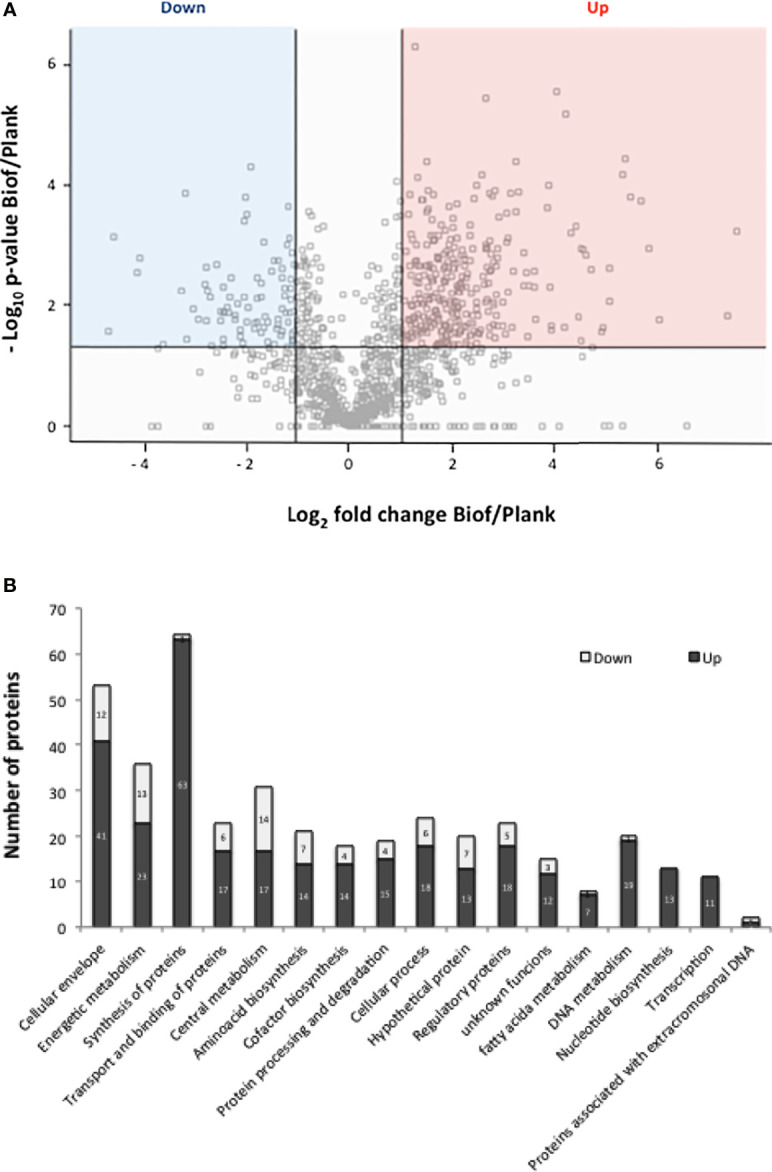
Figure 3.

(A) Volcano plot of protein samples from the clinical isolate B. pertussis BpAR106 grown in biofilm (Biof) or planktonic (Plank) condition. -Log10 of the p-value associated with the magnitude of the fold-change of a given protein between the biofilm and planktonic growth conditions is plotted on the ordinate as a function of the log2 of that fold change on the abscissa. M = log2(fold-change). The overexpressed proteins are indicated in red (M ≥ 1), and the underexpressed proteins in blue (M ≤ −1) based on p<0.05. The proteins located on the 0 line correspond to the ON/OFF proteins since those proteins did not have an associated p-value. (B) Representation of the different clusters of orthologous groups (COGs) containing the proteins differentially expressed under biofilm culture condition of B. pertussis BpAR106. In the figure, the bar length represents the number of overexpressed (black) or underexpressed (gray) proteins within each COG among the total differentially expressed proteins.
