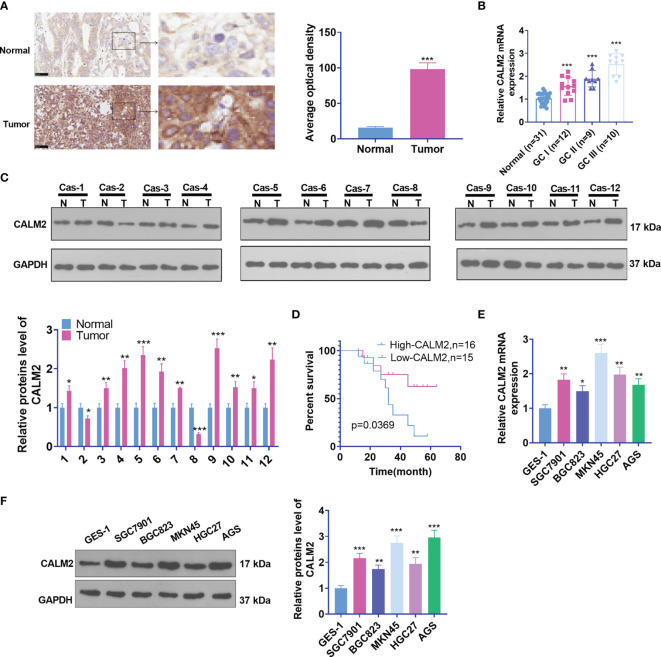
Figure 1.
CALM2 up-regulation was correlated with poorer GC prognosis. (A) CALM2 expression in GC and paired para-carcinoma tissues was figured out through IHC staining. (B) qRT-PCR determined the mRNA level of CALM2 in GC tissues of patients in different clinical phases. (C) The protein level of CALM2 in GC tissues of 12 different GC tissues was evaluated through Western Blot. (D) Kaplan-Meier curve analyzed the correlation between the high or low profile of CALM2 and the survival rate of 31 patients with GC. p = 0.0315. (E) CALM2 mRNA expression in the human gastric epithelial cell line GES-1 and gastric cancer cell lines SGC7901, BGC823, MKN45, HGC27, as well as AGS was confirmed via qRT-PCR. (F) Western Blot measured the protein profile of CALM2 in different GC cell lines. Statistics were displayed as mean ± SD (n = 3). *P < 0.05, **P < 0.01, ***P < 0.001.

