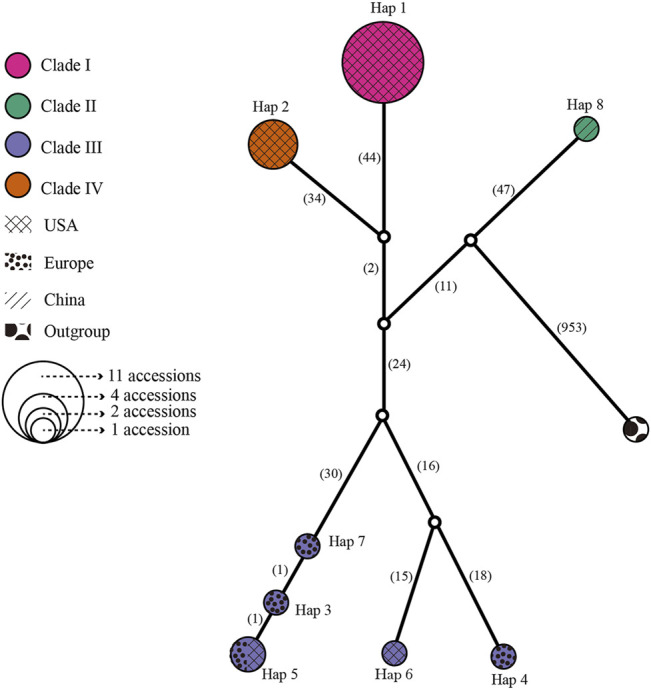
FIGURE 8.

Network for all 22 L. cardiaca accessions base on chloroplast genome sequences. The relative size of each circle corresponds to proportional to haplotype frequencies. Different color represented different clades consistent with phylogenetic relationship. Different texture represented different distributions.
