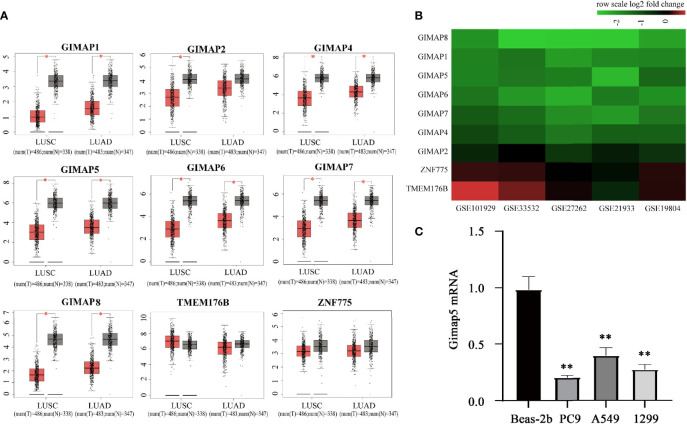
Figure 1.
GIMAP family expression were downregulated in lung cancer. (A) GEPIA boxed plots of GIMAP family in human LUSC, LUAD and normal lungs from TCGA. Transverse axis represents different lung cancer types, LUSC and LUAD and longitudinal axis represents a multiple of the difference in GIMAP gene expression between cancer tissue and normal tissue, and red for lung cancer tissue, gray for normal tissue. *p < 0.01 (LUSC: tumor = 486, normal = 338; LUAD: tumor = 483, normal = 347). (B) The GIMAP family gene was significantly down-regulated in five data sets (abscissa axis), but there were no changes in TMEM176B and ZNF775 adjacent to the family genes (axis of ordinates), red represents up-regulation, green represents down-regulation. The darker the color, the more obvious the difference in expression. (C) Gimap5 expression in various lung cancer cell line or human bronchial epithelial cells (n = 3). **p < 0.01 vs. Beas-2b cells.

