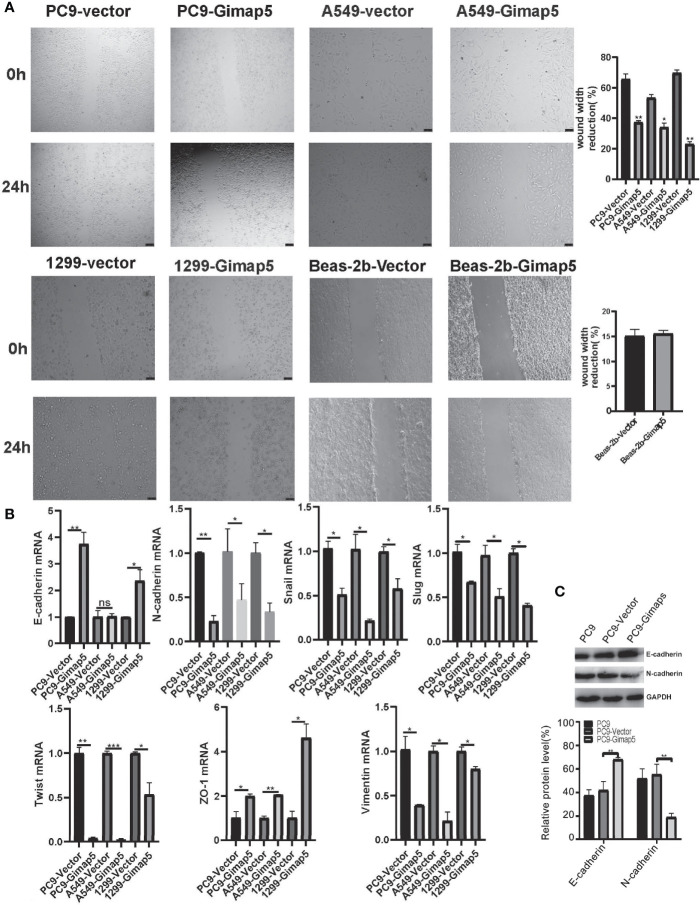
Figure 4.
Gimap5 upregulation inhibited migration and EMT (n = 3). (A) Migration speed of PC9, A549, 1299 and Beas-2b cells (magnification, ×100). (B) The mRNA expression levels of EMT-related biomarker were assayed using qRT-PCR, and the data were expressed as mean ± SEM of the three independent experiments. (C) Western blot was used to detect the expression of E-cadherin and N-cadherin proteins in PC9 cells. After the image scanning gray analysis, the internal reference. GAPDH correction was used to obtain the ratio of each group. (ns means no significance, *p < 0.05 ,**p < 0.01 and ***p < 0.001 vs. empty vector) .

