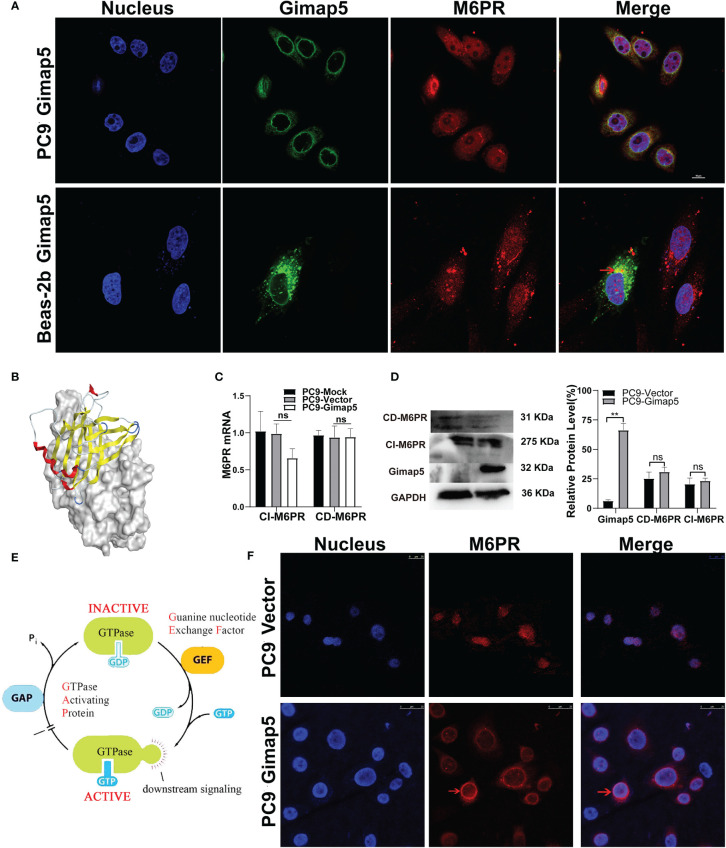
Figure 6.
Gimap5 altered the distribution of M6PR on the lung cancer cells surface. (A) The co-location of Gimap5 and M6PR were examined in PC9-Gimap5 cells and Beas-2b-Gimap5 cells. (magnification, × 1000). (B) Molecular docking diagram of Gimap5 and M6PR. (C) The effect of Gimap5 overexpression on the transcription level of M6PR (ns means no significance). (D) The effect of Gimap5 overexpression on the protein level of M6PR. After the image scanning gray analysis, the internal reference GAPDH correction was used to obtain the ratio of each group (ns means no significance; **p < 0.01 vs. empty vector). (E) Pattern diagram of action mechanism of GIMAP5 GTPase. (F) Gimap5 altered the intracellular distribution of M6PR (magnification, × 400).

