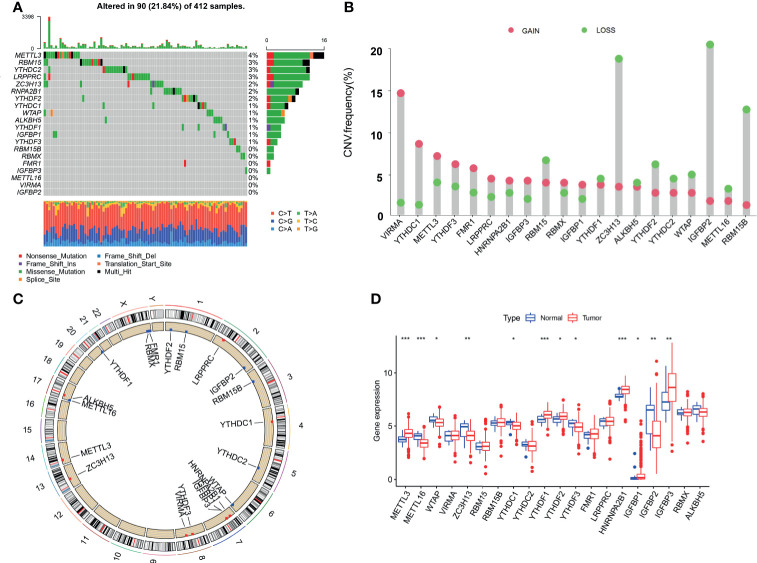
Figure 1.
Genetic landscape and expression changes of the m6A regulator in bladder cancer. (A) Mutation frequency of the m6A regulators of bladder cancer patients in the TCGA-BLCA cohort. (B) A histogram plotting the mutation frequency of each gene obtained by statistical analysis of the copy number of m6A. The abscissa was the m6A-related gene, and the ordinate was the mutation frequency. Red represents an increase in copy number, and green represents loss of copy number. (C) The m6A copy number circle graph. Red represents the sample with missing gene copy number than the sample with increasing copy number. Green represents the sample with missing gene copy number than the sample with increasing copy number. (D) The box plot of m6A differential expression analysis. Red represents the tumor sample, and green represents the normal sample. The *** represents p < 0.0001, ** represents p < 0.01, * represents p < 0.05.

