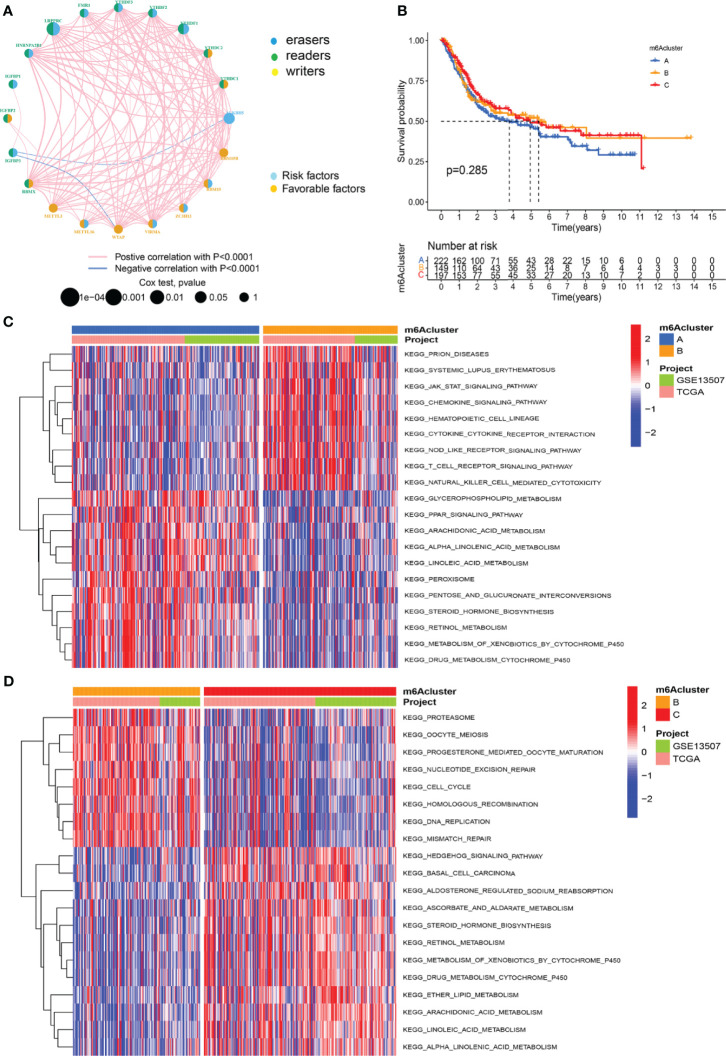
Figure 2.
M6A methylation modification patterns and the biological characteristics of each pattern. (A) M6A regulates the prognosis network diagram. (B) Survival analysis for m6A modification patterns. (C) GSVA analyzed the differences between functional pathways in m6A modification patterns. Blue represents the m6A modification pattern A, and orange represents the m6A modification pattern B. (D) GSVA analyzed the differences between functional pathways in m6A modification patterns. Orange represents the m6A modification pattern B, and red represents the m6A modification pattern C.

