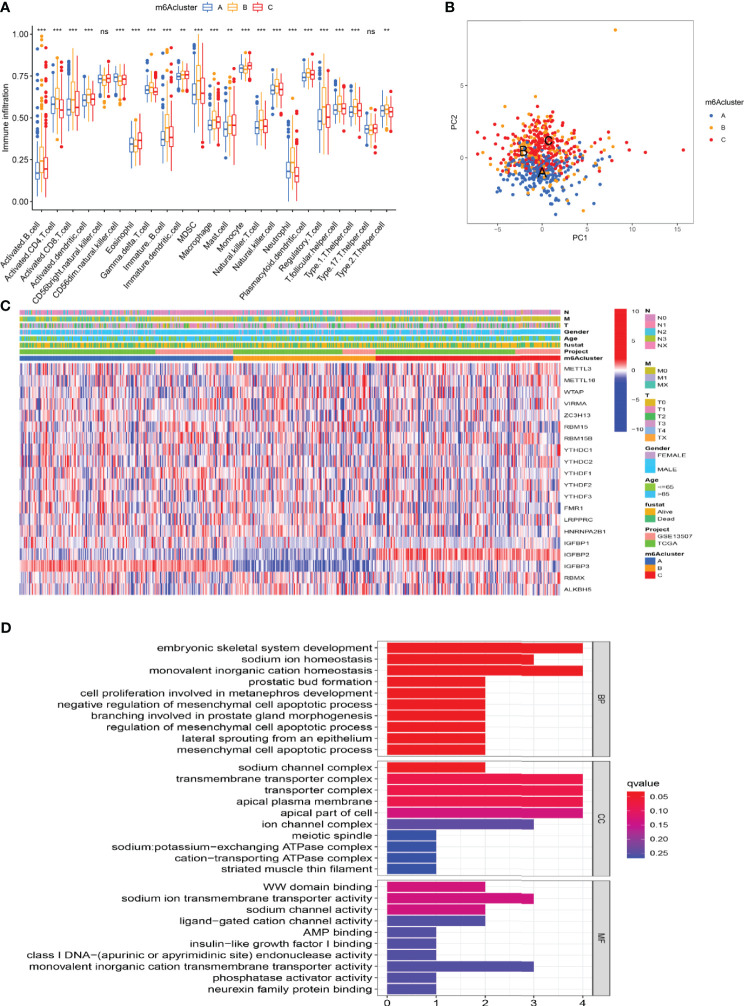
Figure 3.
Characterization of TME cell infiltration and transcriptome features in three m6A modification patterns. (A) The differential expression analysis of 23 immune cells among three m6A modification patterns. The *** represents p < 0.0001, ** represents p < 0.01 and ns represents no significance. (B) The scatter plot of PCA analysis. (C) Unsupervised clustering of 20 m6A regulators of bladder cancer. (D) GO enrichment analysis of m6A-related genes.

