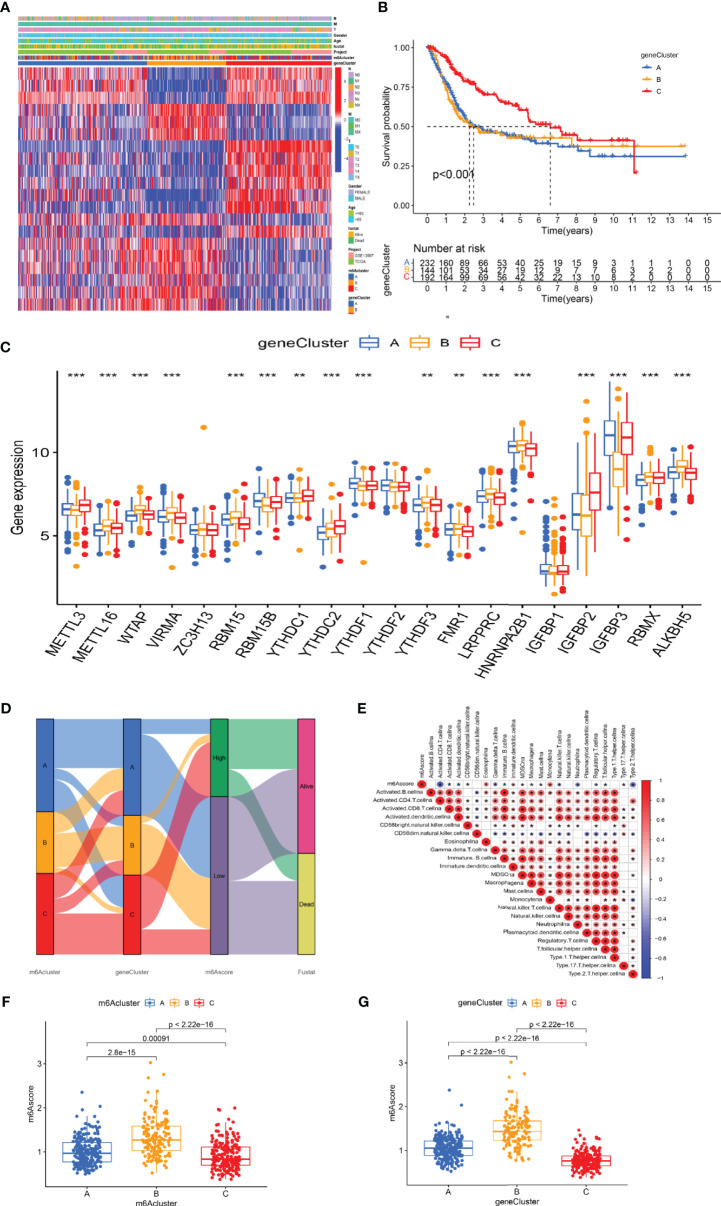
Figure 4.
The development of m6A signature. (A) The heat map of genetic modification patterns. (B) Survival curves of different gene-Clusters. (C) Box plot of the differential expression analysis of m6A-related genes among different gene-Clusters. The *** represents p < 0.0001, ** represents p < 0.01. (D) Sankey diagrams of different genotypes. (E) The correlation analysis between the m6A score and immune cells, with red indicating positive correlation and blue indicating negative correlation. (F) Differential expression analysis of the m6A score in the m6A cluster. (G) Difference analysis of the m6A score in the gene-Cluster.

